Setup Our Load Test and Launch It
- To set up our load test, select the Thread Group element in order to change the following values:
Number of Threads (users): 10
Ramp-Up Period (in seconds): 10
Loop Count: 100
This gives 10 virtual users (VU) who arrive in 10 seconds (1 per second), and each one will make 100 executions of the query sequence.

Figure 1.27: Load test parameters
Caution
Several strategies for setting the load test exists. This point will be discussed deeply in Chapter 2, JMeter Overview.
- We could run our load test directly from the JMeter GUI, but this is not recommended as it would not be optimal for performances of injection (although, in our case, with only 10 users, it shouldn't be a problem).
- When load testing, it is advisable to monitor the injectors (servers where JMeter runs) at least during the first test at full load to validate the correct behavior of the injectors.
This ensures that if we get bad response times, the cause is the application being tested and not JMeter.
Note that this is not specific to JMeter but should be done regardless of the tool you use.
Note
An easy and quick solution to monitor JMeter can be to use the Servers Performance Monitoring plugin from the JMeter Plugins (https://jmeter-plugins.org/wiki/PerfMon/).
- So, let's use best practices directly and run our test from the command line in CLI mode (also called Non-GUI mode in JMeter).
- But before that, to follow our test in real time, we will add the Backend Listener element to enable live monitoring of the progress of the test with Grafana (https://grafana.com/).
- To do this, right-click on Test Plan -> Add -> Listener -> Backend Listener:

Figure 1.28: Add Backend Listener
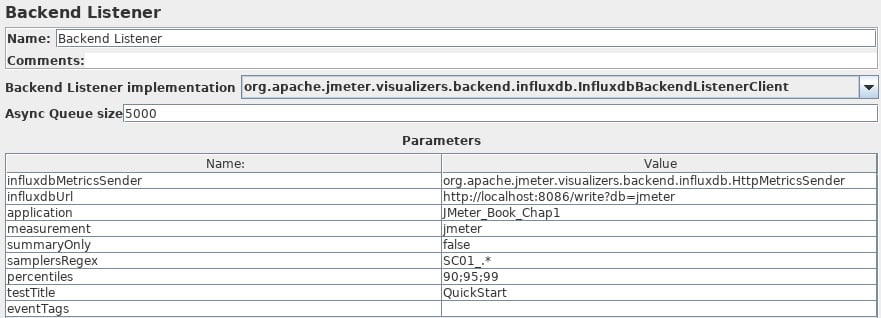
- Let's configure it to send the test results to our InfluxDB database (https://www.influxdata.com/):

Figure 1.29: Backend Listener configuration
Note
In the samplersRegex field, we can use a regular expression to keep only the queries that were recorded by the HTTP(S) Test Script Recorder element (thanks to Prefix: field).


