Descriptive statistics
A descriptive statistic is a function that computes a numeric value which in some way summarizes the data in a numeric dataset.
We saw two statistics in Chapter 3, Data Visualization: the sample mean,  , and the sample standard deviation, s. Their formulas are:

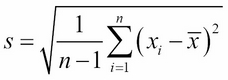
The mean summarizes the central tendency of the dataset. It is also called the simple average or mean average. The standard deviation is a measure of the dispersion of the dataset. Its square, s2, is called the sample variance.
The maximum of a dataset is its greatest value, the minimum is its least value, and the range is their difference.
If w = (w1, w2, …, wn) is a vector with the same number of components as the dataset, then we can use it to define the weighted mean:

In linear algebra, this expression is called the inner product of the two vectors, w and x = (x1, x2, …, xn). Note that if we choose all the weights to be 1/n, then the resulting weighted mean is just the sample mean.
The median...