Search icon CANCEL
Subscription
0
Cart icon
Your Cart (0 item)
Close icon
You have no products in your basket yet
Arrow left icon
Explore Products
Best Sellers
New Releases
Books
Videos
Audiobooks
Learning Hub
Newsletter Hub
Free Learning
Arrow right icon
timer SALE ENDS IN
0 Days
:
00 Hours
:
00 Minutes
:
00 Seconds
Arrow up icon
GO TO TOP
Implementing VMware Horizon 7.7

You're reading from   Implementing VMware Horizon 7.7 Manage and deploy the end-user computing infrastructure for your organization

Arrow left icon
Product type Paperback
Published in Jan 2019
Publisher
ISBN-13 9781789617849
Length 520 pages
Edition 3rd Edition
Arrow right icon
Author (1):
Arrow left icon
Jason Ventresco Jason Ventresco
Author Profile Icon Jason Ventresco
Jason Ventresco
Arrow right icon
View More author details
Toc

Table of Contents (17) Chapters Close

Preface 1. VMware Horizon Infrastructure Overview FREE CHAPTER 2. Implementing Horizon Connection Server 3. Implementing Horizon Composer 4. Implementing Horizon Security Server 5. Implementing Horizon Unified Access Gateway 6. Implementing a Horizon Cloud Pod 7. Creating Horizon Desktop Pools 8. Implementing the Microsoft Remote Desktop Services Application and Desktop Pools 9. Performing Horizon Pool Maintenance 10. Creating a Master Virtual Desktop Image 11. Implementing App Volumes 12. Implementing User Environment Manager 13. Implementing the Just-in-Time Management Platform (JMP) 14. Using Horizon PowerCLI 15. Assessments 16. Other Books You May Enjoy

Optimization results – CPU utilization

Horizon recommends a maximum of 8 to 10 desktops per physical CPU core. There is no guarantee that your Horizon implementation will be able to attain this high consolidation ratio, though, as desktop workloads will vary from one type of user to another. The optimization techniques described in this chapter will help maximize the number of desktops you can run per server core.

The following graph shows the reduction in ESXi server % Processor Time that occurred after performing the optimization techniques described later in this chapter:
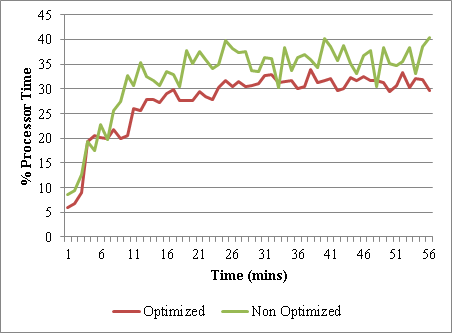
% Processor Time is one of the metrics that can be used to measure server processor utilization within vSphere. The statistics in the preceding graph were captured using the vSphere ESXTOP command-line utility, which provides a number of performance statistics that the vCenter performance tabs do not...
lock icon The rest of the chapter is locked
Register for a free Packt account to unlock a world of extra content!
A free Packt account unlocks extra newsletters, articles, discounted offers, and much more. Start advancing your knowledge today.
Unlock this book and the full library FREE for 7 days
Get unlimited access to 7000+ expert-authored eBooks and videos courses covering every tech area you can think of
Renews at $19.99/month. Cancel anytime