Debugging your application
NativeScript uses the built-in Chrome debugging tools to allow you to debug your application on Android and a similar set of tools in Safari for iOS. You can start the debugging in one of two ways. You can start the debugging when you launch your application using nativescript debug android --debug-brk [--device / --emulator / --geny] to launch your application with the debugger active. The second way is if your application is currently running, you can use nativescript debug ios --start [ --device / --emulator / --geny] to connect to an already running application.
Note
NativeScript currently requires a working Internet connection for debugging. It also requires Chrome to be installed to debug Android applications.
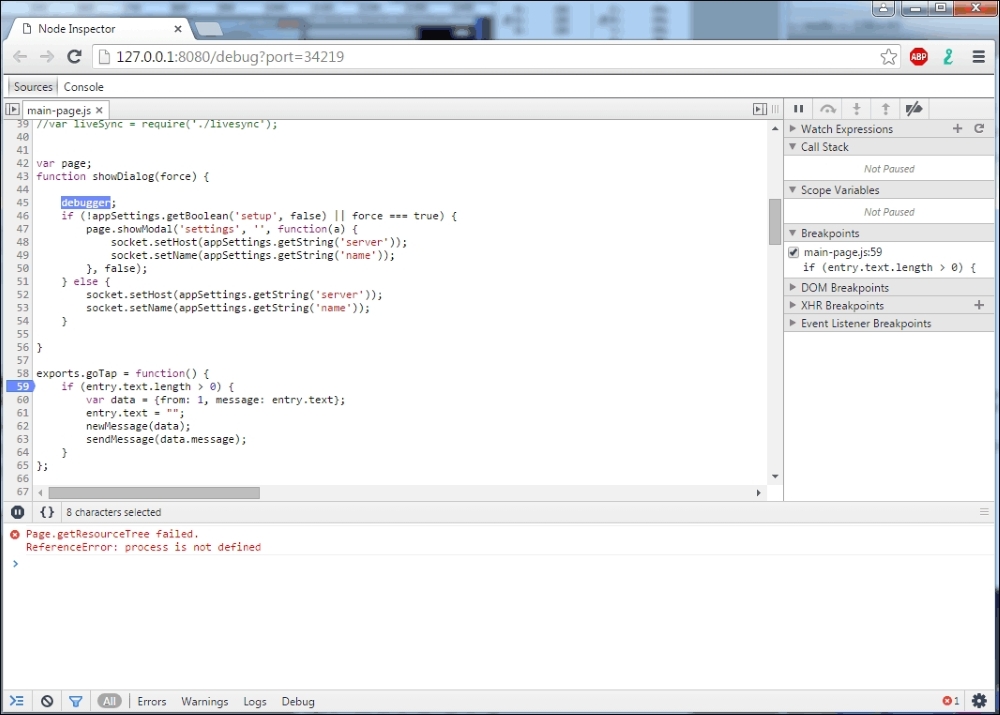
Once you have launched the debug tools, you should see something like this on Android:

This is the Node inspector that you can use in Chrome to debug your web pages and even node apps. NativeScript is leveraging the same code that Google wrote for Chrome...


