Analyzing data
In the process of making decisions, everyone now uses data. Let’s look at an example for your next trip to Barcelona, which is a beautiful city in Spain. If you want to plan a summer trip to Spain and need a place to stay, you might look on Airbnb for a cool place to stay and set some parameters (called filters in the world of data and analytics).
Let’s see what these filters, or parameters, are:
- The dates of our vacation period
- The number of people that are joining you
- Select a super host (we mostly do this because we have some experience)
- The area that you want to go to
- The type of accommodation
- Maybe even some special things that you want (swimming pool, air conditioning, and so on)
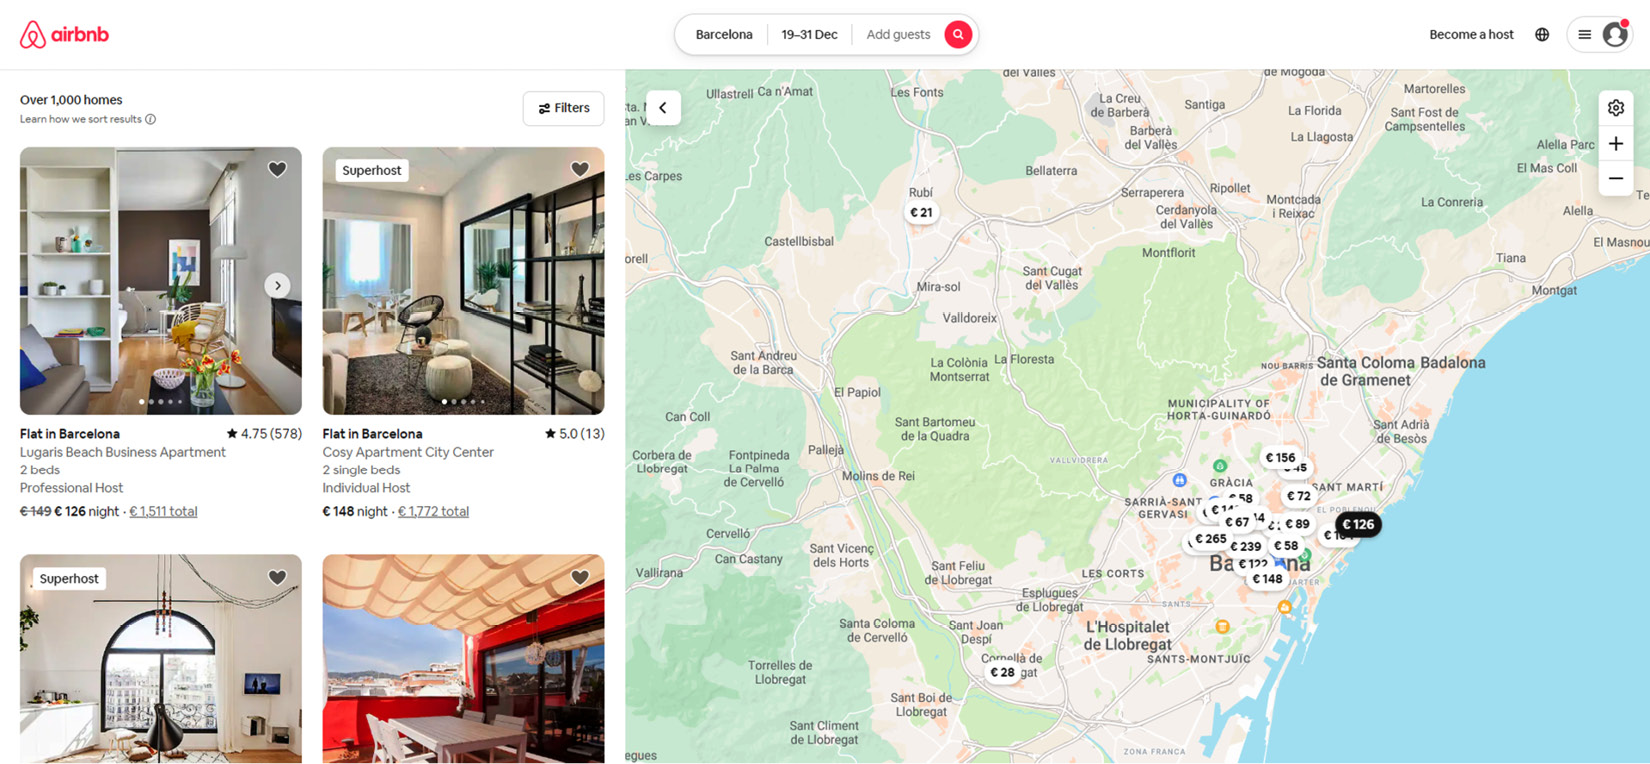
The following is a screenshot of Airbnb and how we set our filters to find a place to stay in Barcelona, for example:

Figure 1.2 – DIDM for the summer vacation using Airbnb
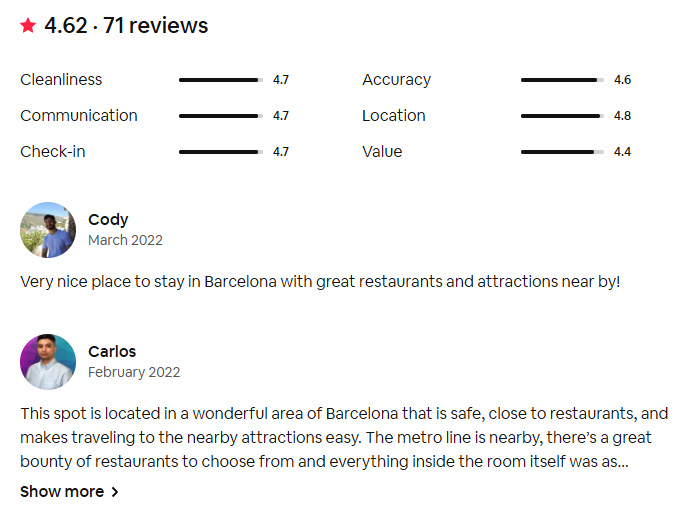
When the list has a lot of places you could go to, you might want to put the ones with the best prices or most reviews at the top, as shown in the following screenshot:

Figure 1.3 – DIDM reviews to make a choice
From there, we’ll read and think about some reviews, which will tell us a lot about the place we want to stay at. We will book a place to stay for our upcoming trip from there. In this case, we looked at data, sorted it, read about it, talked about it with the family, argued about it, and then decided where to stay during our vacation.
In this example, we’ve used data and the information that we found during our investigation (analysis) and created a decision together on where to go. In our line of work, we call this a data-informed decision.
To clarify the difference between data and information, data exists of data elements, and information is created from that data and put in context. We can’t perceive anything from data unless we give meaning to that data. When we look at information, that is not the case.
Searching and finding information
First, we’ll take a look at intentional or purposeful searching. Let’s go over some of the things we’ve talked about in the first part. We noticed that we could answer some questions with a purpose and some answers we found by accident, or as we say, unintentionally. When we wake up, one of our first thoughts is mostly set on, What should I wear today? So, we checked the weather. This was done to answer the question, What should I wear today? The other question we were trying to answer with the data was about our upcoming trip to Barcelona, Spain. Our question, Where should I stay in Barcelona? has been answered, and we’re going to a nice place with lots of good reviews and a price we can afford. Those two questions had a purpose, a goal, and we were able to decide what to wear today and we found a cool place to stay.
Reading our social media messages on Twitter or other social media platforms, the news, and stories about the pandemic gives us information that has no purpose; we were just scrolling and reading without any purpose or meaning. We could also look at ads for clothes or other shopping items without meaning to. Those actions are unintentional; there is no underlying specific question that we want to answer.
This is where data literacy comes in. Everyone on earth has some data literacy skills, even if they don’t know it. We all work with data, even if we don’t know it.
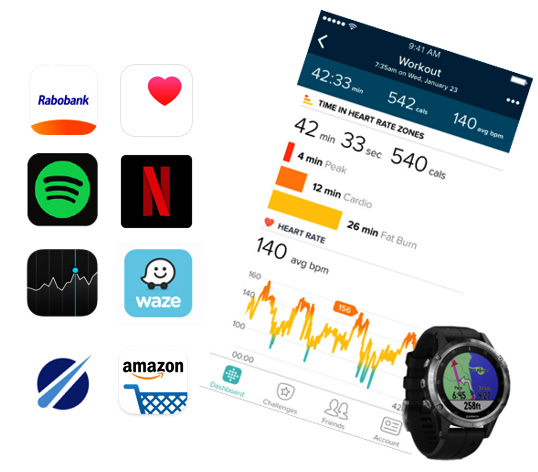
Let’s look at some of the apps we use every day to see what we mean. These apps use certain algorithms (using smart logic) to help organizations give us just the information they think we might be interested in:

Figure 1.4 – How we use data during our days
Most of us use data and analytics every day in our personal lives. Here are some examples:
- Personal health data: The health app collects data about your health from your iPhone, Apple Watch, and other apps you already use. This way, you can see all your progress in one place. Health apps keep track of how far you walk, run, and how many steps you take. And if you have an Apple Watch, it keeps track of your activity data automatically.
- Financial transactions: A bank can tell you where you spend your money, but they can also use simple algorithms to check your credit card for any unusual charges. When a transaction is made and they think it might be a fraud because of their smart algorithms, they immediately block your credit card and send you a message telling you that someone tried to use your credit card in a fraudulent way. Also, don’t forget that on the stock market, people buy and sell stocks by using information gathered from data.
- Amazon: When you shop on Amazon, it shows you products that it thinks you’ll be interested in based on a lot of complicated math. As an example, when we ordered a whiteboard, two suggestions about whiteboard markers and a special wiper for cleaning the whiteboard popped up on our screens right away. All of this was done because we asked for a whiteboard as our first order.
- Spotify: It is used all over the world and it knows exactly what kind of music you like and gives you a list of your most played songs at the end of every year. It can even tell you what to listen to next and invite you to new podcasts based on what you’ve listened to in the past, among other things.
- Netflix: It has more than 203.67 million subscribers around the world. Since it started, it have become the most popular platform for streaming content. It grew even more than usual during the COVID-19 pandemic.
How did it become so successful? It used sophisticated data and analytics, which helped in many ways, such as:
- It was able to give users personalized suggestions for movies and TV shows
- It was able to figure out how popular new content would be before it was approved (or not)
- It could make marketing content such as trailers and thumbnail images to make the user experience more personal
- It was able to improve its own production planning in-house
- And, of course, it was able to improve business and technical decision making in general
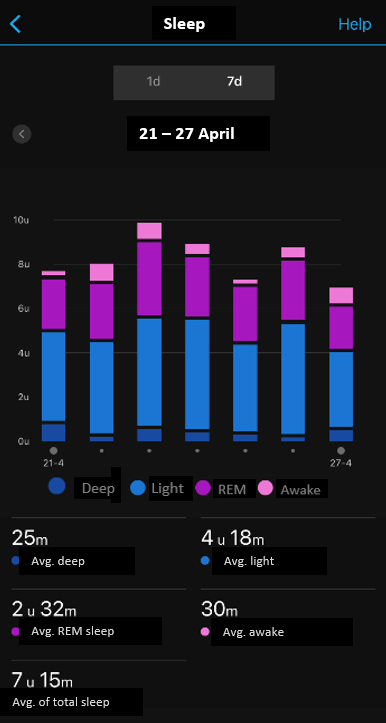
- Your Garmin watch: The Garmin watch tells us how many steps we’ve taken (we experience it as a significant motivator to reach the 10K steps every day). Even though they say it’s not 100% accurate, our nights of sleep are tracked. We can see when we’re in REM sleep, when we’re awake, or when we’re sleeping in a light state. It also keeps track of our heart rate, how many times we climbed stairs (or mountains), and so on. It gives us a full picture of what we do 24 hours a day, including our stress level, heart rate, and how we do sports, in a fancy way.
When we use it with an app such as My Fitness Pal, for example, we can link our data with the food we eat during the day, as shown in the following Figure 1.5:

Figure 1.5 – Tracking your sleep
As you can see, all the activities that are measured serve a purpose, such as shopping, keeping an eye on our health, listening to our favorite music (and making playlists that we can share), and last but not least, watching movies and TV shows that we like. In Chapter 9, Handling Data Responsibly, we will talk about how we work with data, what you need to watch out for, and the risks that can happen when we share our own data.
Then, we get unintentional data use unintentionally. We use platforms such as Facebook, Instagram, LinkedIn, and Twitter to share news about our work or even our personal lives. We love that people are reading, liking, and even sharing our messages. Let’s be honest, we get excited when people like something we’ve written.
However, reading the news through different apps on our devices (iPad, tablet, or laptop) to stay up to date on what’s going on in the world is also an unintentional way we use data, especially since the COVID-19 pandemic hit us in 2020.
What does this intentional and unintentional data use mean? And how does it pertain to data literacy? Is data literacy the same for everyone? Well to be honest that depends what your role is within the Data and Analytics field of work. For a data analyst it would mean understanding the data related to a certain process, or transactional system, the tools that an organization uses and so on. For a data scientist, it would mean understanding the algorithms and data that is needed to create their models. For a marketing professional or a company that wants to grow, it is again different. The marketeer needs to understand how to read the created information from the data used from the website, social media platforms, and so on. But for someone who wants to take a vacation in Spain, the information they need is completely different. So, it depends on the role, the position that you are in when it comes to the understanding and level of Data Literacy.


