
Data Type Conversion
Another common operation in data cleanup is getting the data types right. This helps with detecting invalid values and applying the right operations. The main types stored in pandas are as follows:
float (float64, float32)
integer (int64, int32)
datetime (datetime64[ns, tz])
timedelta (timedelta[ns])
bool
object
category
Types can be set on, read, or inferred by pandas. Usually, if pandas cannot detect what data type the column is, it assumes that is object that stores the data as strings.
To transform the data into the right data types, we can use conversion functions such as to_datetime, to_numeric, or astype. Category types, columns that can only assume a limited number of options, are encoded as the category type.
Exercise 5: Exploring Data Types
Transform the data types in our example DataFrame to the correct types with the pandas astype function. Let's use the sample dataset from https://opendata.socrata.com/:
Import the required libraries, as illustrated here:
import numpy as np
import pandas as pd
import matplotlib.pyplot as plt
import seaborn as sns
Read the data from the dataset as follows:
url = "https://opendata.socrata.com/api/views/cf4r-dfwe/rows.csv?accessType=DOWNLOAD"
df = pd.read_csv(url)
Check the current data types using the dtypes function on the DataFrame:
df.dtypes
Use the to_datetime method to convert the dates from string format to datetime format:
df['Date Posted'] = pd.to_datetime(df['Date Posted'])
df['Date Collected'] = pd.to_datetime(df['Date Collected'])
columns = df.columns
id_cols = ['State', 'Location', "Date Posted", 'Date Collected', 'Sample Type', 'Unit']
columns = list(set(columns) - set(id_cols))
columns
The output is as follows:
['Co-60',
 'Cs-136',
 'I-131',
 'Te-129',
 'Ba-140',
 'Cs-137',
 'Cs-134',
 'I-133',
 'I-132',
 'Te-132',
 'Te-129m']
Use Lambda function:
df['Cs-134'] = df['Cs-134'].apply(lambda x: np.nan if x == "Non-detect" else x)
df.loc[:, columns] = df.loc[:, columns].applymap(lambda x: np.nan if x == 'Non-detect' else x)
df.loc[:, columns] = df.loc[:, columns].applymap(lambda x: np.nan if x == 'ND' else x)
Apply the to_numeric method to the list of numeric columns created in the previous activity to convert the columns to the correct numeric types:
for col in columns:
    df[col] = pd.to_numeric(df[col])
Check the types of the columns again. They should be float64 for the numeric columns and datetime64[ns] for the date columns:
df.dypes
Use the astype method to transform the columns that are not numeric to the category type:
df['State'] = df['State'].astype('category')
df['Location'] = df['Location'].astype('category')
df['Unit'] = df['Unit'].astype('category')
df['Sample Type'] = df['Sample Type'].astype('category')
Check the types with the dtype function for the last time:
df.dtypes
The output is as follows:
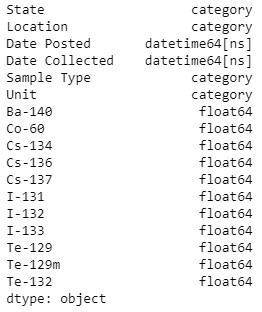
Figure 1.15: DataFrame and its types
Now our dataset looks fine, with all values correctly cast to the right types. But correcting the data is only part of the story. We want, as analysts, to understand the data from different perspectives. For example, we may want to know which state has the most contamination, or the radionuclide that is the least prevalent across cities. We may ask about the number of valid measurements present in the dataset. All these questions have in common transformations that involve grouping data together and aggregating several values. With pandas, this is accomplished with GroupBy. Let's see how we can use it by key and aggregate the data.