Search icon CANCEL
Subscription
0
Cart icon
Your Cart (0 item)
Close icon
You have no products in your basket yet
Arrow left icon
Explore Products
Best Sellers
New Releases
Books
Videos
Audiobooks
Learning Hub
Newsletter Hub
Free Learning
Arrow right icon
timer SALE ENDS IN
0 Days
:
00 Hours
:
00 Minutes
:
00 Seconds
Arrow up icon
GO TO TOP
Scientific Computing with Python 3

You're reading from   Scientific Computing with Python 3 An example-rich, comprehensive guide for all of your Python computational needs

Arrow left icon
Product type Paperback
Published in Dec 2016
Publisher Packt
ISBN-13 9781786463517
Length 332 pages
Edition 1st Edition
Languages
Tools
Arrow right icon
Authors (4):
Arrow left icon
Jan Erik Solem Jan Erik Solem
Author Profile Icon Jan Erik Solem
Jan Erik Solem
Claus Fuhrer Claus Fuhrer
Author Profile Icon Claus Fuhrer
Claus Fuhrer
Olivier Verdier Olivier Verdier
Author Profile Icon Olivier Verdier
Olivier Verdier
Claus Führer Claus Führer
Author Profile Icon Claus Führer
Claus Führer
Arrow right icon
View More author details
Toc

Table of Contents (17) Chapters Close

Preface 1. Getting Started FREE CHAPTER 2. Variables and Basic Types 3. Container Types 4. Linear Algebra – Arrays 5. Advanced Array Concepts 6. Plotting 7. Functions 8. Classes 9. Iterating 10. Error Handling 11. Namespaces, Scopes, and Modules 12. Input and Output 13. Testing 14. Comprehensive Examples 15. Symbolic Computations - SymPy References

Basic plotting


The standard plotting function is plot. Calling plot(x,y) creates a figure window with a plot of y as a function of x. The input arguments are arrays (or lists) of equal length. It is also possible to use plot(y), in which case the values in y will be plotted against their index, that is, plot(y) is a short form of plot(range(len(y)),y).

Here is an example that shows how to plot sin(x) for x ϵ [-2π, 2π]  using 200 sample points and sets markers at every fourth point:

# plot sin(x) for some interval
x = linspace(-2*pi,2*pi,200)
plot(x,sin(x))

# plot marker for every 4th point
samples = x[::4]
plot(samples,sin(samples),'r*')

# add title and grid lines
title('Function sin(x) and some points plotted')
grid()

The result is shown in the following figure (Figure 6.1):
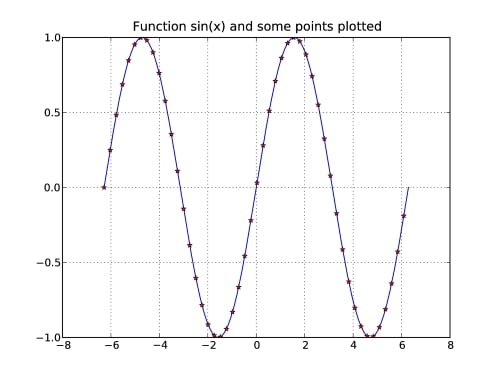
Figure 6.1: A plot of the function sin(x) with grid lines shown.

As you can see, the standard plot is a solid blue curve. Each axis gets automatically scaled to fit...

lock icon The rest of the chapter is locked
Register for a free Packt account to unlock a world of extra content!
A free Packt account unlocks extra newsletters, articles, discounted offers, and much more. Start advancing your knowledge today.
Unlock this book and the full library FREE for 7 days
Get unlimited access to 7000+ expert-authored eBooks and videos courses covering every tech area you can think of
Renews at $19.99/month. Cancel anytime