Are all features equally important? In this case, we used 13 input features, and they all contributed to the model. However, an important question here is, How do we know which features are more important? Obviously, not all features contribute equally to the output. In case we want to discard some of them later, we need to know which features are less important. We have this functionality available in scikit-learn.
Computing the relative importance of features
Getting ready
Let's calculate the relative importance of the features. Feature importance provides a measure that indicates the value of each feature in the construction of the model. The more an attribute is used to build the model, the greater its relative importance. This importance is explicitly calculated for each attribute in the dataset, allowing you to classify and compare attributes to each other. Feature importance is an attribute contained in the model (feature_importances_).
How to do it...
Let's see how to compute the relative importance of features:
- Let's see how to extract this. Add the following lines to housing.py:
DTFImp= dt_regressor.feature_importances_
DTFImp= 100.0 * (DTFImp / max(DTFImp))
index_sorted = np.flipud(np.argsort(DTFImp))
pos = np.arange(index_sorted.shape[0]) + 0.5
The regressor object has a callable feature_importances_ method that gives us the relative importance of each feature. To compare the results, the importance values have been normalized. Then, we ordered the index values and turned them upside down so that they are arranged in descending order of importance. Finally, for display purposes, the location of the labels on the x-axis has been centered.
- To visualize the results, we will plot the bar graph:
plt.figure()
plt.bar(pos, DTFImp[index_sorted], align='center')
plt.xticks(pos, housing_data.feature_names[index_sorted])
plt.ylabel('Relative Importance')
plt.title("Decision Tree regressor")
plt.show()
- We just take the values from the feature_importances_ method and scale them so that they range between 0 and 100. Let's see what we will get for a decision tree-based regressor in the following output:
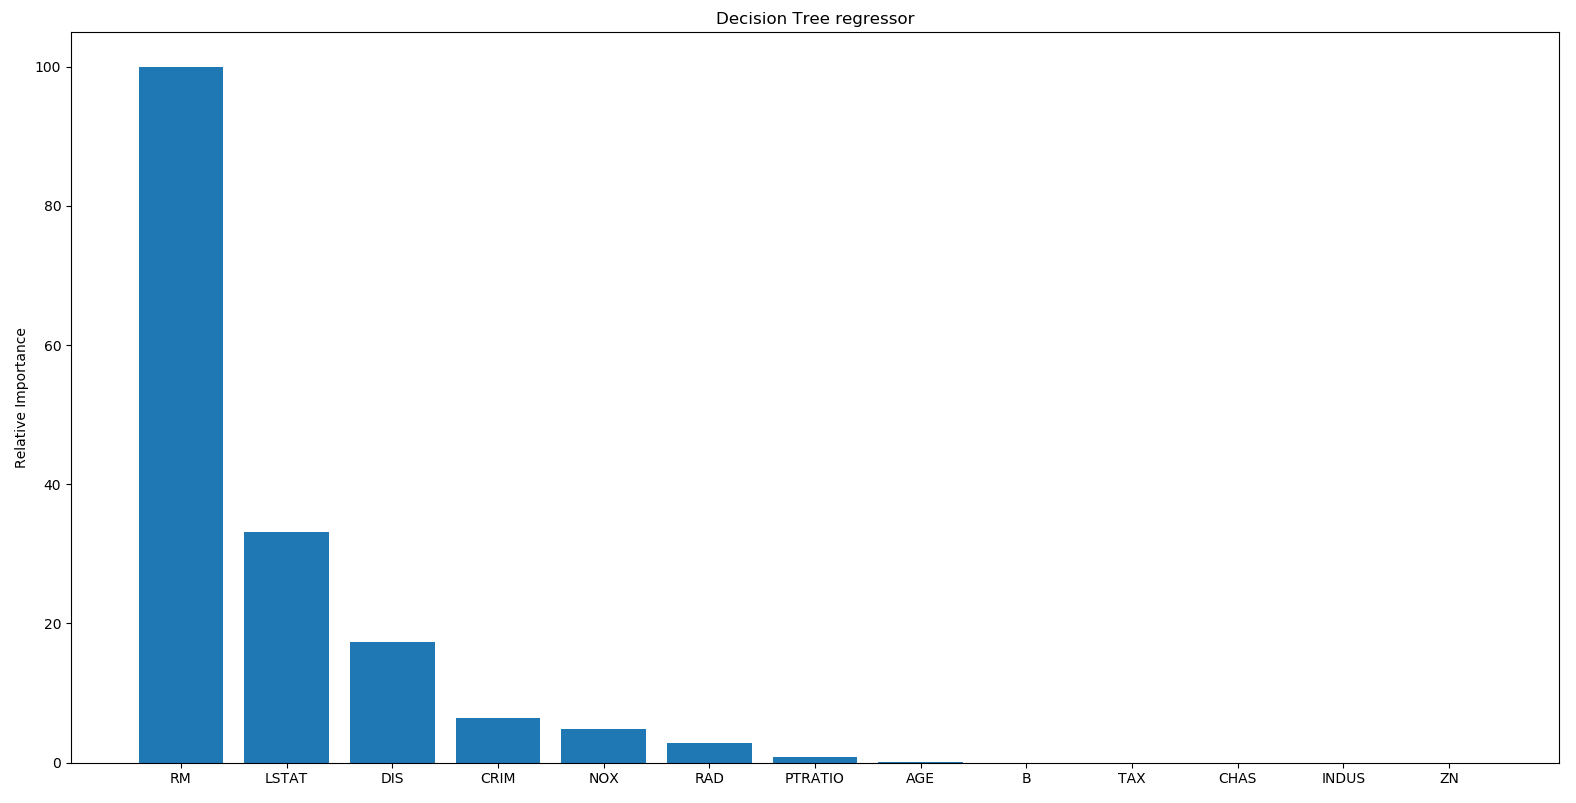
So, the decision tree regressor says that the most important feature is RM.
- Now, we carry out a similar procedure for the AdaBoost model:
ABFImp= ab_regressor.feature_importances_
ABFImp= 100.0 * (ABFImp / max(ABFImp))
index_sorted = np.flipud(np.argsort(ABFImp))
pos = np.arange(index_sorted.shape[0]) + 0.5
- To visualize the results, we will plot the bar graph:
plt.figure()
plt.bar(pos, ABFImp[index_sorted], align='center')
plt.xticks(pos, housing_data.feature_names[index_sorted])
plt.ylabel('Relative Importance')
plt.title("AdaBoost regressor")
plt.show()
Let's take a look at what AdaBoost has to say in the following output:
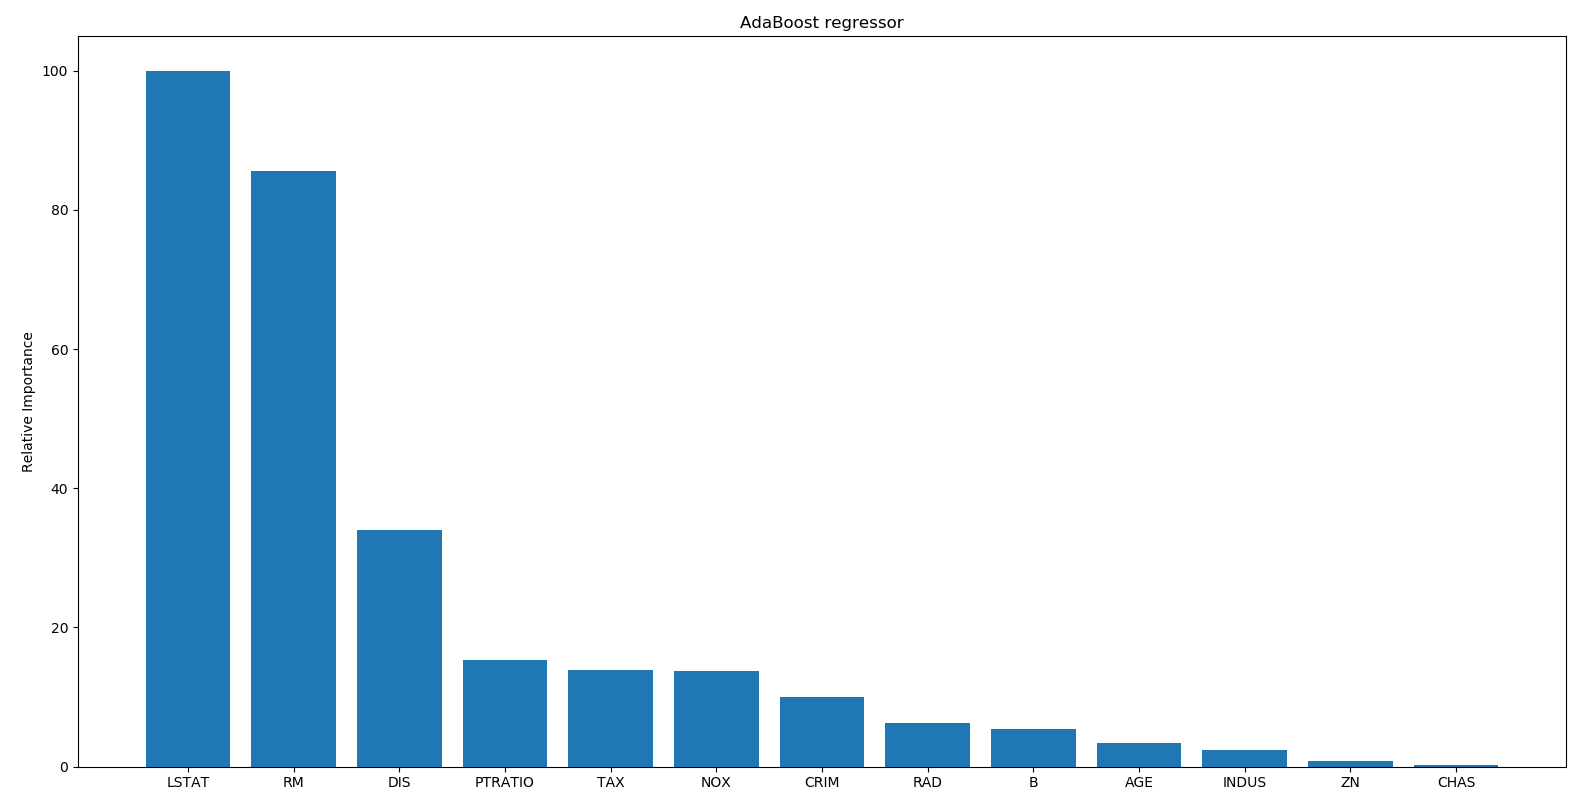
According to AdaBoost, the most important feature is LSTAT. In reality, if you build various regressors on this data, you will see that the most important feature is in fact LSTAT. This shows the advantage of using AdaBoost with a decision tree-based regressor.
How it works...
Feature importance provides a measure that indicates the value of each feature in the construction of a model. The more an attribute is used to build a model, the greater its relative importance. In this recipe, the feature_importances_ attribute was used to extract the relative importance of the features from the model.
There's more...
Relative importance returns the utility of each characteristic in the construction of decision trees. The more an attribute is used to make predictions with decision trees, the greater its relative importance. This importance is explicitly calculated for each attribute in the dataset, allowing you to classify and compare attributes to each other.
See also
- Scikit-learn's official documentation of the DecisionTreeRegressor function: https://scikit-learn.org/stable/modules/generated/sklearn.tree.DecisionTreeRegressor.html