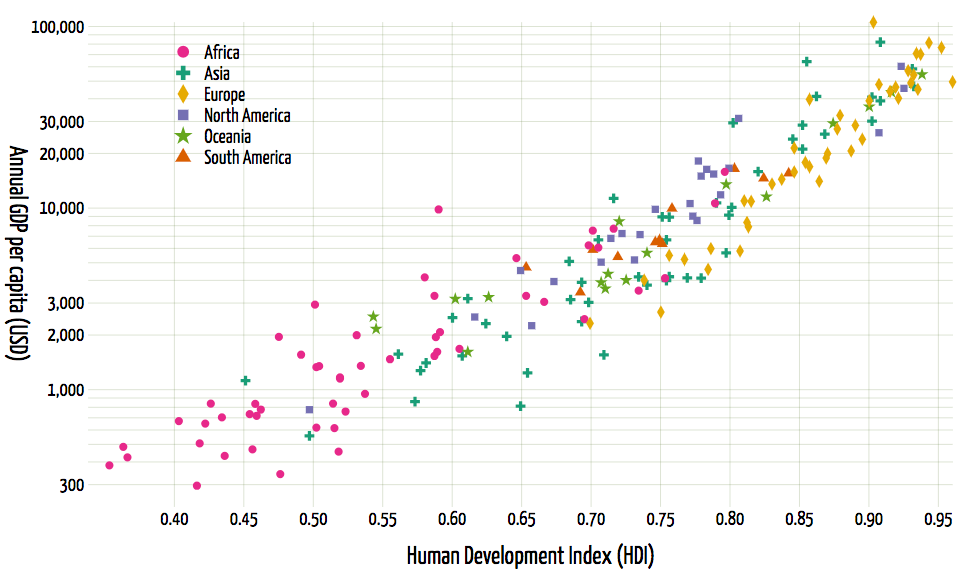
Symbols are preconfigured shapes that are commonly used to identify value points in line charts and scatterplots. For example, instead of using colors, you can use different symbols to distinguish categories (see Symbol/3-scatter.html).

A scatterplot using different symbols for each cagtegory. Code: Symbol/3-scatter.html.
A symbol generator function is created with d3.symbol(), which returns an SVG path data string representing a 64x64 pixel circle as default:
const circle = d3.symbol();
To render the symbol, the string should be assigned to the <path> element's d attribute, and its center coordinates translated to a visible position, since the default center coordinates are (0,0).
The following table lists two methods that can be used to configure symbols:
|
Method |
Description |
|
type(function) |
This receives a function that draws the symbol. It can... |


