Search icon CANCEL
Subscription
0
Cart icon
Your Cart (0 item)
Close icon
You have no products in your basket yet
Save more on your purchases! discount-offer-chevron-icon
Savings automatically calculated. No voucher code required.
Arrow left icon
Explore Products
Best Sellers
New Releases
Books
Videos
Audiobooks
Learning Hub
Free Learning
Arrow right icon
Arrow up icon
GO TO TOP
Deep Learning with R Cookbook

You're reading from   Deep Learning with R Cookbook Over 45 unique recipes to delve into neural network techniques using R 3.5.x

Arrow left icon
Product type Paperback
Published in Feb 2020
Publisher Packt
ISBN-13 9781789805673
Length 328 pages
Edition 1st Edition
Languages
Tools
Arrow right icon
Authors (3):
Arrow left icon
Swarna Gupta Swarna Gupta
Author Profile Icon Swarna Gupta
Swarna Gupta
Rehan Ali Ansari Rehan Ali Ansari
Author Profile Icon Rehan Ali Ansari
Rehan Ali Ansari
Dipayan Sarkar Dipayan Sarkar
Author Profile Icon Dipayan Sarkar
Dipayan Sarkar
Arrow right icon
View More author details
Toc

Table of Contents (11) Chapters Close

Preface 1. Understanding Neural Networks and Deep Neural Networks 2. Working with Convolutional Neural Networks FREE CHAPTER 3. Recurrent Neural Networks in Action 4. Implementing Autoencoders with Keras 5. Deep Generative Models 6. Handling Big Data Using Large-Scale Deep Learning 7. Working with Text and Audio for NLP 8. Deep Learning for Computer Vision 9. Implementing Reinforcement Learning 10. Other Books You May Enjoy

Training your first deep neural network

In the previous recipe, Implementing a single-layer neural network, we implemented a simple baseline neural network for a classification task. Continuing with that model architecture, we will create a deep neural network. A deep neural network consists of several hidden layers that can be interpreted geometrically as additional hyperplanes. These networks learn to model data in complex ways and learn complex mappings between inputs and outputs. 

The following diagram is an example of a deep neural network with two hidden layers:

In this recipe, we will learn how to implement a deep neural network for a multi-class classification problem.

Getting ready

In this recipe, we will use the MNIST digit dataset. This is a database of handwritten digits that consists of 60,000 28x28 grayscale images of the 10 digits, along with a test set of 10,000 images. We will build a model that will recognize handwritten digits from this dataset. 

To start, let's load the keras library:

library(keras)

Now, we can do some data preprocessing and model building.

How to do it...

The MNIST dataset is included in keras and can be accessed using the dataset_mnist() function:

  1. Let's load the data into the R environment:
mnist <- dataset_mnist()
x_train <- mnist$train$x
y_train <- mnist$train$y
x_test <- mnist$test$x
y_test <- mnist$test$y
  1. Our training data is of the form (images, width, height). Due to this, we'll convert the data into a one-dimensional array and rescale it:
# Reshaping the data
x_train <- array_reshape(x_train , c(nrow(x_train),784))
x_test <- array_reshape(x_test , c(nrow(x_test),784))

# Rescaling the data
x_train <- x_train/255
x_test <- x_test/255
  1. Our target data is an integer vector and contains values from 0 to 9. We need to one-hot encode our target variable in order to convert it into a binary matrix format. We use the to_categorical() function from keras to do this:
y_train <- to_categorical(y_train,10)
y_test <- to_categorical(y_test,10)
  1. Now, we can build the model. We use the Sequential API from keras to configure this model. Note that in the first layer's configuration, the input_shape argument is the shape of the input data; that is, it's a numeric vector of length 784 and represents a grayscale image. The final layer outputs a length 10 numeric vector (probabilities for each digit from 0 to 9) using a softmax activation function:
model <- keras_model_sequential()
model %>%
layer_dense(units = 256, activation = 'relu', input_shape = c(784)) %>%
layer_dropout(rate = 0.4) %>%
layer_dense(units = 128, activation = 'relu') %>%
layer_dropout(rate = 0.3) %>%
layer_dense(units = 10, activation = 'softmax')

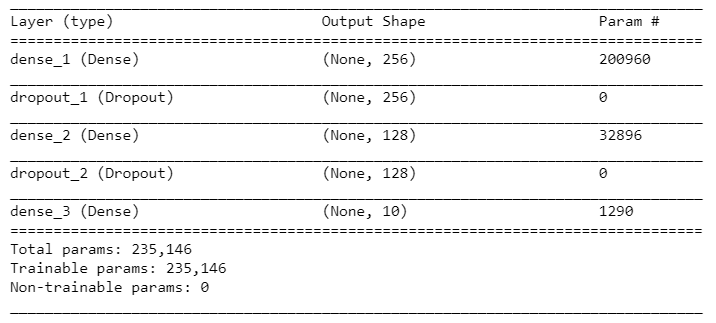
Let's look at the details of the model:

summary(model)

Here's the model's summary:
  1. Next, we go ahead and compile our model by providing some appropriate arguments, such as the loss function, optimizer, and metrics. Here, we have used the rmsprop optimizer. This optimizer is similar to the gradient descent optimizer, except that it can increase our learning rate so that our algorithm can take larger steps in the horizontal direction, thus converging faster:
model %>% compile(
loss = 'categorical_crossentropy',
optimizer = optimizer_rmsprop(),
metrics = c('accuracy')
)
  1. Now, let's fit the training data to the configured model. Here, we've set the number of epochs to 30, the batch size to 128, and the validation percentage to 20:
history <- model %>% fit(
x_train, y_train,
epochs = 30, batch_size = 128,
validation_split = 0.2
)
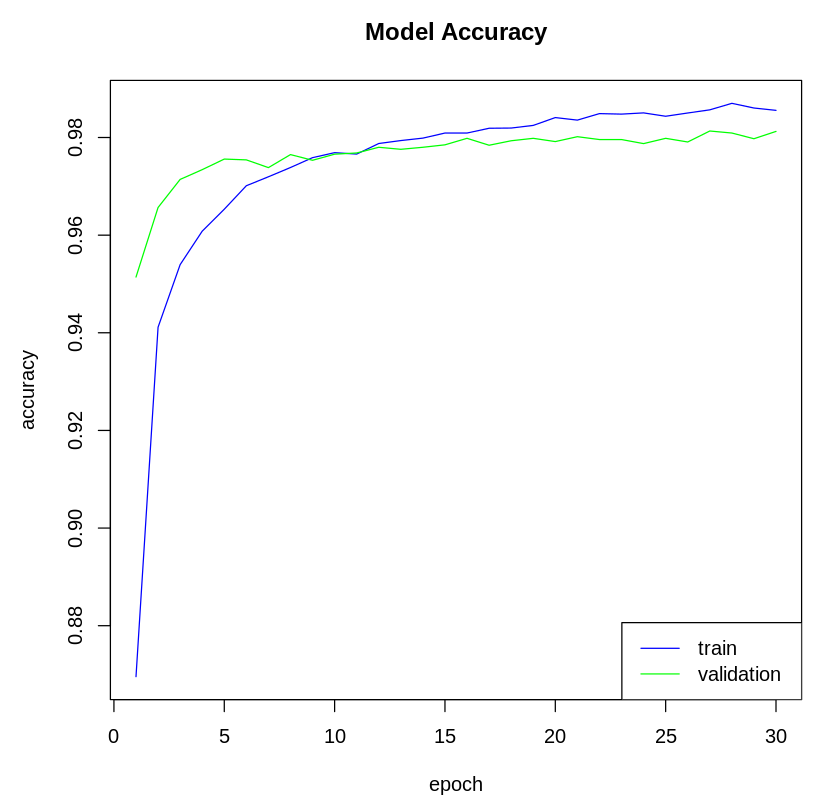
  1. Next, we visualize the model metrics. We can plot the model's accuracy and loss metrics from the history variable. Let's plot the model's accuracy:
# Plot the accuracy of the training data
plot(history$metrics$acc, main="Model Accuracy", xlab = "epoch", ylab="accuracy", col="blue",
type="l")

# Plot the accuracy of the validation data
lines(history$metrics$val_acc, col="green")

# Add Legend
l
egend("bottomright", c("train","validation"), col=c("blue", "green"), lty=c(1,1))

The following plot shows the model's accuracy on the training and test dataset:
Now, let's plot the model's loss:

# Plot the model loss of the training data
plot(history$metrics$loss, main="Model Loss", xlab = "epoch", ylab="loss", col="blue", type="l")

# Plot the model loss of the validation data
lines(history$metrics$val_loss, col="green")

# Add legend
legend("topright", c("train","validation"), col=c("blue", "green"), lty=c(1,1))

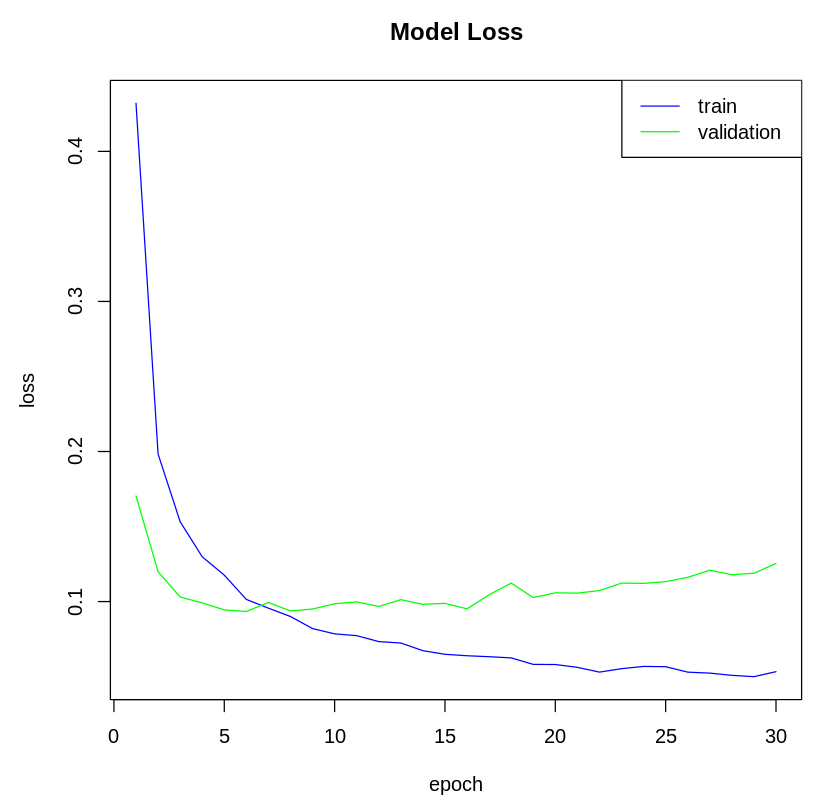
The following plot shows the model's loss on the training and test dataset:
  1. Now, we predict the classes for the test data instances using the trained model:
model %>% predict_classes(x_test)
  1. Let's check the accuracy of the model on the test data:
model %>% evaluate(x_test, y_test)

The following diagram shows the model metrics on the test data:

Here, we got an accuracy of around 97.9 %.

How it works...

In step 1, we loaded the MNIST dataset. The x data was a 3D array of grayscale values of the form (images, width, height). In step 2, we flattened these 28x28 images into a vector of length 784. Then, we normalized the grayscale values between 0 and 1. In step 3, we one-hot encoded the target variable using the to_categorical() function from keras to convert this into a binary format matrix.

In step 4, we built a sequential model by stacking dense and dropout layers. In a dense layer, every neuron receives input from all the neurons of the previous layer, which is why it's known as being densely connected. In our model, each layer took input from the previous layer and applied an activation to the output of our previous layer. We used the relu activation function in the hidden layers and the softmax activation function in the last layer since we had 10 possible outcomes. Dropout layers are used for regularizing deep learning models. Dropout refers to the process of not considering certain neurons in the training phase during a particular forward or backward pass in order to prevent overfitting. The summary() function provides us with a summary of the model; it gives us information about each layer, such as the shape of the output and the parameters in each layer.

In step 5, we compiled the model using the compile() function from keras. We applied the rmsprop() optimizer to find the weights and biases that minimize our objective loss function, categorical_crossentropy. The metrics argument calculates the metric to be evaluated by the model during training.

In step 6, we trained our model for a fixed number of iterations, which is defined by the epochs argument. The validation_split argument can take float values between 0 and 1 and specifies the fraction of the data to be used as validation data. Finally, batch_size defines the number of samples that will be propagated through the network. The history object records the training metrics for each epoch and contains two lists, params and metrics. The params contains the model's parameters, such as batch size, steps, and so on, while metrics contains model metrics such as loss and accuracy. 

In step 7, we visualized the model's accuracy and loss metrics. In step 8, we used our model to generate predictions for the test data using the predict_classes() function. Lastly, we evaluated the model's accuracy on the test data using the evaluate() function.

There's more...

Tuning is the process of maximizing a model's performance without overfitting or underfitting. This can be achieved by setting appropriate values for the model parameters. A deep neural network has multiple parameters that can be tuned; layers, hidden units optimization parameters such as an optimizer, the learning rate, and the number of epochs.

To tune Keras model parameters, we need to define flags for the parameters that we want to optimize. These are defined by the flags() function of the keras package, which returns an object of the tfruns_flags type. This contains information about the parameters to be tuned. In the following code block, we have declared four flags that will tune the dropout rate and the number of neurons in the first and second layers of the model. flag_integer("dense_units1",8) tunes the number of units in layer 1, dense_units1 is the name of the flag, and 8 is the default number of neurons:

# Defining flags
FLAGS <- flags(
flag_integer("dense_units1",8),
flag_numeric("dropout1",0.4),
flag_integer("dense_units2",8),
flag_numeric("dropout2", 0.3)
)

 Once we have defined the flags, we use them in the definition of our model. In the following code block, we have defined our model using the parameters that we want to tune:

# Defining model
model <- keras_model_sequential()
model %>%
layer_dense(units = FLAGS$dense_units1, activation = 'relu', input_shape = c(784)) %>%
layer_dropout(rate = FLAGS$dropout1) %>%
layer_dense(units = FLAGS$dense_units2, activation = 'relu') %>%
layer_dropout(rate = FLAGS$dropout2) %>%
layer_dense(units = 10, activation = 'softmax')

The preceding two code blocks are code snippets from the hyperparamexcter_tuning_model.R script, which is available in this book's GitHub repository. In the script, we have implemented a model for classifying MNIST digits. Executing this script does not tune your hyperparameters; it just defines the parameterized training runs to create the best model.

The following code block shows how we can fine-tune the model defined in hyperparameter_tuning_model.R. Here, we used the tuning_run() function from the tfruns package. The tfruns package provides a suite of tools for tracking, visualizing, and managing TensorFlow training runs and experiments from R. The file argument of the function should be the path to the training script and should contain flags and the model definition. The flags argument takes a list of key-value pairs where the key names must match the names of the different flags that we defined in our model. The tuning_run() function executes training runs for every combination of the specified flags. By default, all the runs go into the runs subdirectory of the current working directory. It returns a dataframe that contains summary information about all the runs, such as evaluation, validation and performance loss (categorical_crossentropy), and metrics (accuracy):

library(tfruns)

# training runs
runs <- tuning_run(file = "hypereparameter_tuning_model.R", flags = list(
dense_units1 = c(8,16),
dropout1 = c(0.2, 0.3, 0.4),
dense_units2 = c(8,16),
dropout2 = c(0.2, 0.3, 0.4)
))
runs

Here are the results from each run during hyperparameter tuning:

For each training run, we get the model metrics for the training and validation data.

See also

lock icon The rest of the chapter is locked
Register for a free Packt account to unlock a world of extra content!
A free Packt account unlocks extra newsletters, articles, discounted offers, and much more. Start advancing your knowledge today.
Unlock this book and the full library FREE for 7 days
Get unlimited access to 7000+ expert-authored eBooks and videos courses covering every tech area you can think of
Renews at $19.99/month. Cancel anytime
Banner background image