Implementing forward and backward fill
Time series data also show missing values. To impute missing data in time series, we use specific methods. Forward fill imputation involves filling missing values in a dataset with the most recent non-missing value that precedes it in the data sequence. In other words, we carry forward the last seen value to the next valid value. Backward fill imputation involves filling missing values with the next non-missing value that follows it in the data sequence. In other words, we carry the last valid value backward to its preceding valid value.
In this recipe, we will replace missing data in a time series with forward and backward fills.
How to do it...
Let’s begin by importing the required libraries and time series dataset:
- Let’s import
pandasandmatplotlib:import matplotlib.pyplot as plt import pandas as pd
- Let’s load the air passengers dataset that we described in the Technical requirements section and display the first five rows of the time series:
df = pd.read_csv(
    "air_passengers.csv",
    parse_dates=["ds"],
    index_col=["ds"],
)
print(df.head())
We see the time series in the following output:
                y
ds
1949-01-01  112.0
1949-02-01  118.0
1949-03-01  132.0
1949-04-01  129.0
1949-05-01  121.0
Note
You can determine the percentage of missing data by executing df.isnull().mean().
- Let’s plot the time series to spot any obvious data gaps:
ax = df.plot(marker=".", figsize=[10, 5], legend=None)
ax.set_title("Air passengers")
ax.set_ylabel("Number of passengers")
ax.set_xlabel("Time")
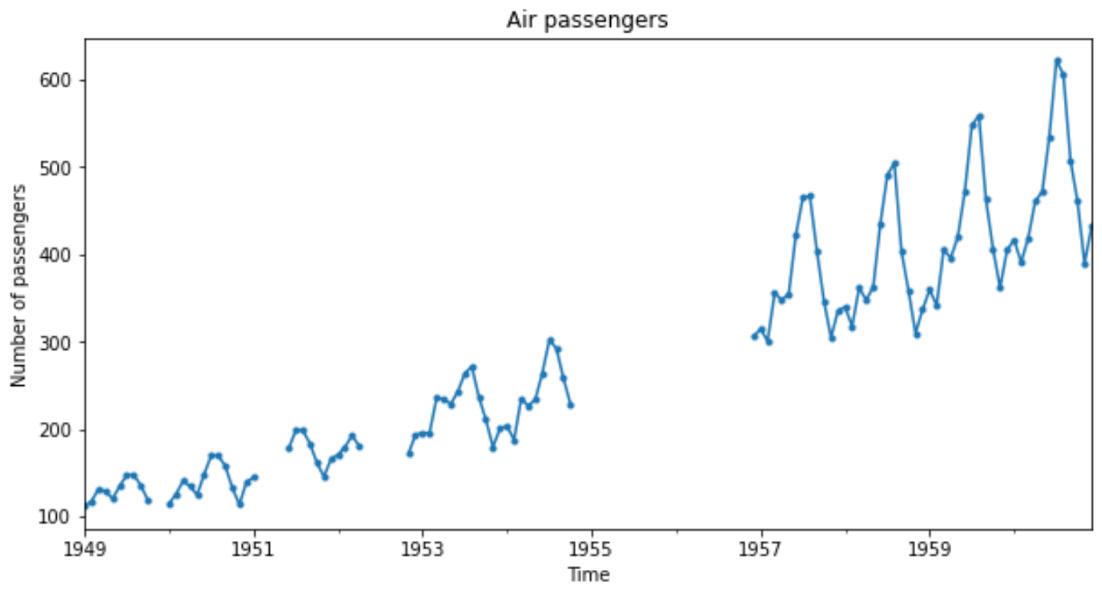
The previous code returns the following plot, where we see intervals of time where data is missing:

Figure 1.5 – Time series data showing missing values
- Let’s impute missing data by carrying the last observed value in any interval to the next valid value:
df_imputed = df.ffill()
You can verify the absence of missing data by executing
df_imputed.isnull().sum(). - Let’s now plot the complete dataset and overlay as a dotted line the values used for the imputation:
ax = df_imputed.plot(
    linestyle="-", marker=".", figsize=[10, 5])
df_imputed[df.isnull()].plot(
    ax=ax, legend=None, marker=".", color="r")
ax.set_title("Air passengers")
ax.set_ylabel("Number of passengers")
ax.set_xlabel("Time")
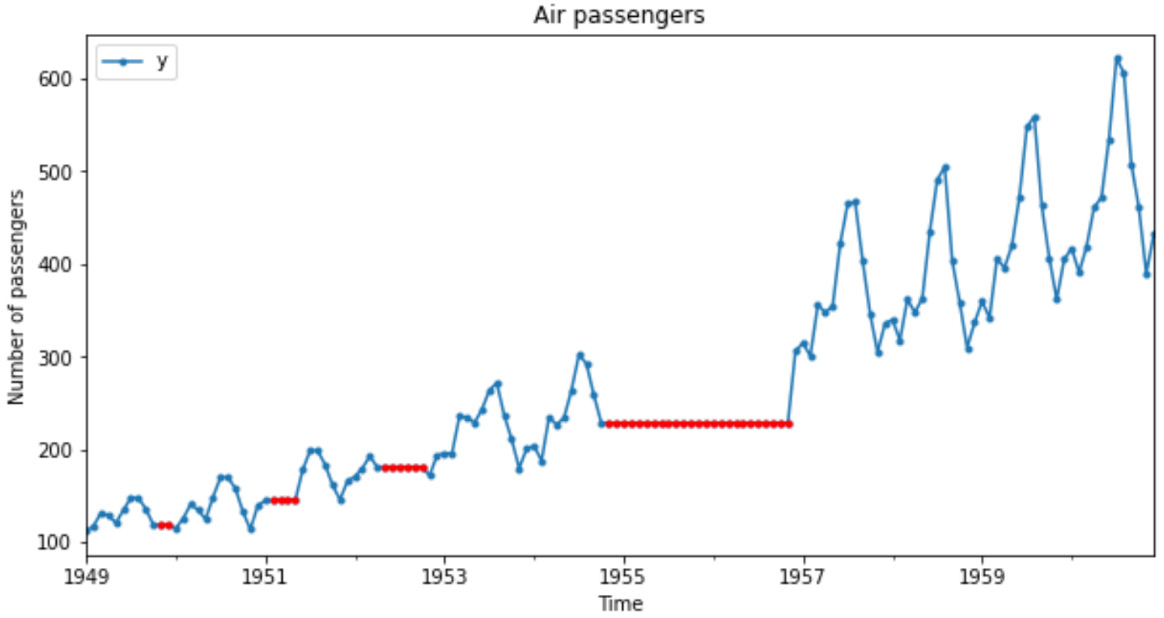
The previous code returns the following plot, where we see the values used to replace
nanas dotted lines overlaid in between the continuous time series lines:

Figure 1.6 – Time series data where missing values were replaced by the last seen observations (dotted line)
- Alternatively, we can impute missing data using backward fill:
df_imputed = df.bfill()
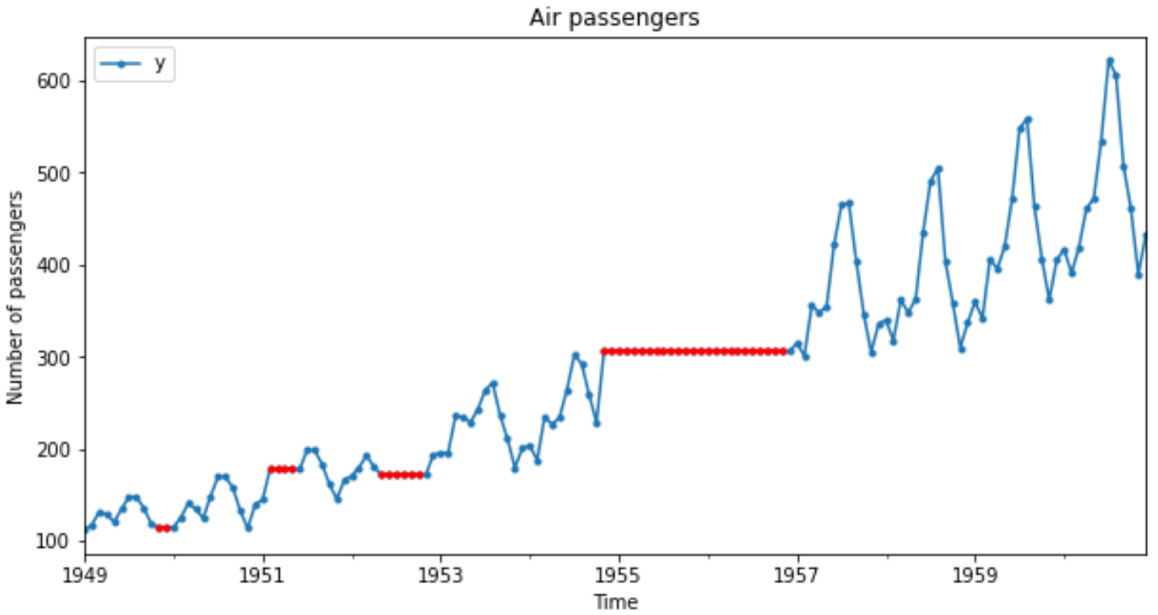
If we plot the imputed dataset and overlay the imputation values as we did in step 5, we’ll see the following plot:

Figure 1.7 – Time series data where missing values were replaced by backward fill (dotted line)
Note
The heights of the values used in the imputation are different in Figures 1.6 and 1.7. In Figure 1.6, we carry the last value forward, hence the height is lower. In Figure 1.7, we carry the next value backward, hence the height is higher.
We’ve now obtained complete datasets that we can use for time series analysis and modeling.
How it works...
pandas ffill() takes the last seen value in any temporal gap in a time series and propagates it forward to the next observed value. Hence, in Figure 1.6 we see the dotted overlay corresponding to the imputation values at the height of the last seen observation.
pandas bfill() takes the next valid value in any temporal gap in a time series and propagates it backward to the previously observed value. Hence, in Figure 1.7 we see the dotted overlay corresponding to the imputation values at the height of the next observation in the gap.
By default, ffill() and bfill() will impute all values between valid observations. We can restrict the imputation to a maximum number of data points in any interval by setting a limit, using the limit parameter in both methods. For example, ffill(limit=10) will only replace the first 10 data points in any gap.


