Search icon CANCEL
Subscription
0
Cart icon
Your Cart (0 item)
Close icon
You have no products in your basket yet
Save more on your purchases! discount-offer-chevron-icon
Savings automatically calculated. No voucher code required.
Arrow left icon
Explore Products
Best Sellers
New Releases
Books
Videos
Audiobooks
Learning Hub
Newsletter Hub
Free Learning
Arrow right icon
timer SALE ENDS IN
0 Days
:
00 Hours
:
00 Minutes
:
00 Seconds
Arrow up icon
GO TO TOP
Microsoft Azure Architect Technologies: Exam Guide AZ-300

You're reading from   Microsoft Azure Architect Technologies: Exam Guide AZ-300 A guide to preparing for the AZ-300 Microsoft Azure Architect Technologies certification exam

Arrow left icon
Product type Paperback
Published in Jan 2020
Publisher Packt
ISBN-13 9781838553531
Length 540 pages
Edition 1st Edition
Languages
Tools
Arrow right icon
Authors (2):
Arrow left icon
Sjoukje Zaal Sjoukje Zaal
Author Profile Icon Sjoukje Zaal
Sjoukje Zaal
Sjoukje Zaal Sjoukje Zaal
Author Profile Icon Sjoukje Zaal
Sjoukje Zaal
Arrow right icon
View More author details
Toc

Table of Contents (30) Chapters Close

Preface 1. Section 1: Deploying and Configuring Infrastructure
2. Analyzing Resource Utilization and Consumption FREE CHAPTER 3. Creating and Configuring Storage Accounts 4. Implementing and Managing Virtual Machines 5. Implementing and Managing Virtual Networking 6. Creating Connectivity between Virtual Networks 7. Managing Azure Active Directory (Azure AD) 8. Implementing and Managing Hybrid Identities 9. Section 2: Implementing Workloads and Security
10. Migrating Servers to Azure 11. Configuring Serverless Computing 12. Implementing Application Load Balancing 13. Integrating On-Premises Networks with Azure Virtual Network 14. Managing Role-Based Access Control (RBAC) 15. Implementing Multi-Factor Authentication (MFA) 16. Section 3: Creating and Deploying Apps
17. Creating Web Apps by Using PaaS 18. Designing and Developing Apps That Run in Containers 19. Section 4: Implementing Authentication and Secure Data
20. Implementing Authentication 21. Implementing Secure Data Solutions 22. Section 5: Developing for the Cloud and for Azure Storage
23. Developing Solutions That Use Cosmos DB Storage 24. Developing Solutions That Use a Relational Database 25. Message-Based Integration Architecture and Autoscaling 26. Mock Questions
27. Mock Answers
28. Assessments 29. Another Book You May Enjoy

Configuring diagnostic settings on resources

You can also configure diagnostic settings on different Azure resources. There are two types of diagnostic logs available in Azure Monitor:

  • Tenant logs: These logs consist of all of the tenant-level services that exist outside of an Azure subscription. An example of this is the Azure Active Directory logs.
  • Resource logs: These logs consist of all of the data from the resources that are deployed inside an Azure subscription, for example, virtual machines, storage accounts, and network security groups.

The contents of the resource logs are different for every Azure resource. These logs differ from guest OS-level diagnostic logs. To collect OS-level logs, an agent needs to be installed on the virtual machine. The diagnostic logs don't require an agent to be installed; they can be accessed directly from the Azure portal.

The logs that can be accessed are stored inside a storage account and can be used for auditing or manual inspection purposes. You can specify the retention time in days by using the resource diagnostic settings. You can also stream the logs to event hubs to analyze them in Power BI or insert them into a third-party service. These logs can also be analyzed with Azure Monitor. Then, there will be no need to store them in a storage account first.

Enabling diagnostic settings

To enable the diagnostic settings for resources, perform the following steps:

  1. Navigate to the Azure portal by opening https://portal.azure.com.
  2. Go to the VM again. Make sure that the VM is running, and in the left-hand menu, under Monitoring, select Diagnostic settings.
  3. The Diagnostic Settings blade will open up. You will need to select a storage account where the metrics can be stored.
  1. Click on the Enable guest-level monitoring button to update the diagnostic settings for the virtual machine:
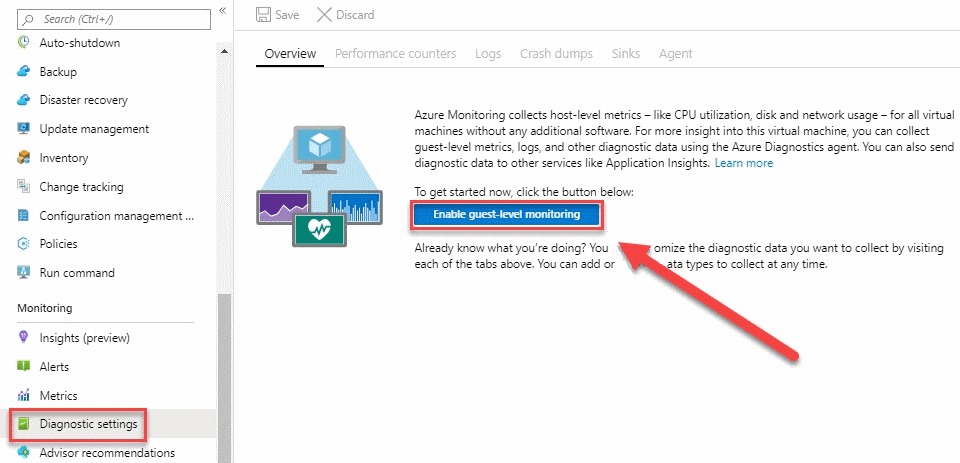
Enabling diagnostic settings for a virtual machine
  1. When the settings are updated, you can go to Metrics in the top menu to set the metrics that are collected. The syslog blade is used for setting the minimum log level.
  2. New metrics will be available from the metrics blade after enabling diagnostic logging in Azure Monitor. You can analyze them in the same way that we did earlier in this chapter, in the Metrics section.

In the next section, we're going to look at the Azure Log Analytics service, which is now a part of Azure Monitor as well.

You have been reading a chapter from
Microsoft Azure Architect Technologies: Exam Guide AZ-300
Published in: Jan 2020
Publisher: Packt
ISBN-13: 9781838553531
Register for a free Packt account to unlock a world of extra content!
A free Packt account unlocks extra newsletters, articles, discounted offers, and much more. Start advancing your knowledge today.
Unlock this book and the full library FREE for 7 days
Get unlimited access to 7000+ expert-authored eBooks and videos courses covering every tech area you can think of
Renews at $19.99/month. Cancel anytime
Banner background image