Arc diagrams are linear layouts that place nodes along a horizontal axis connected by arcs. They are good for networks that don't have many nodes or connections, or sequential topologies with few orthogonal links (e.g. train networks). They are also better than chord layouts to represent directional flows, since links in opposite directions span arcs on different sides of the axis.
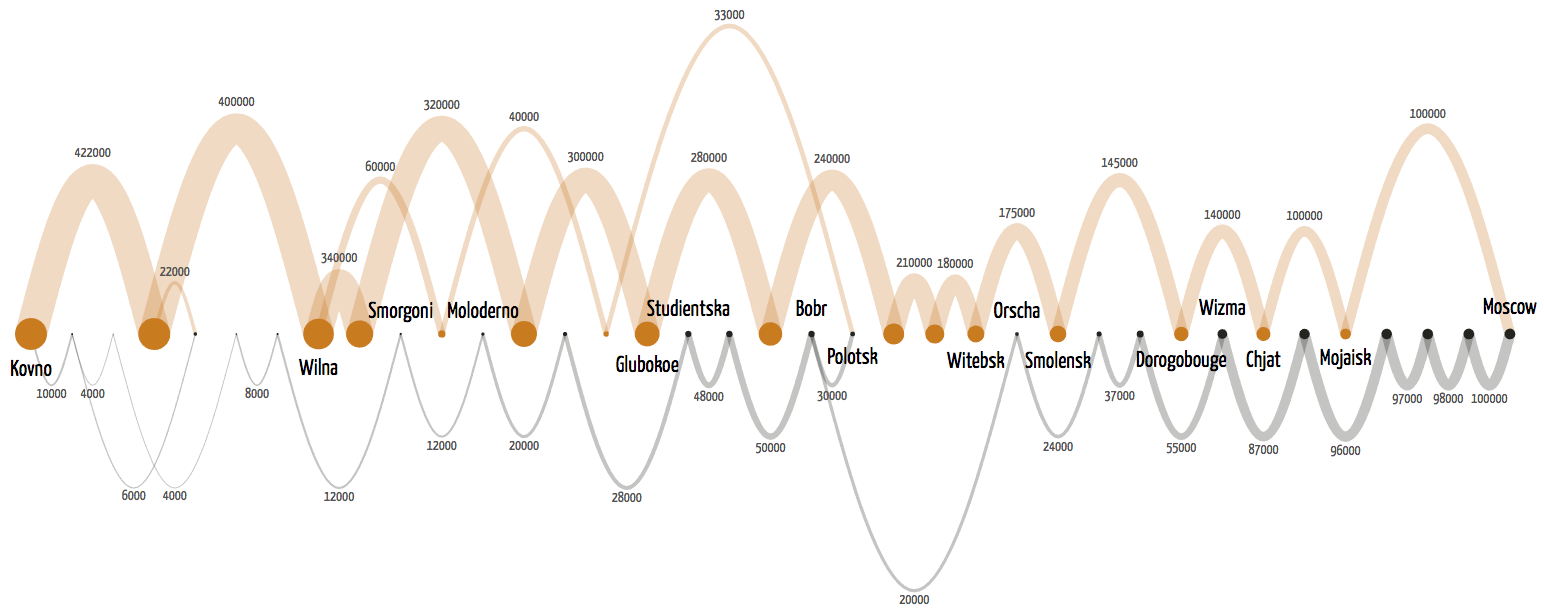
The following example is another version of Minard's Russian Campaign chart. Each node is a location and the arcs are troops. The width of each line is the number of troops marching between each location. The ochre-colored arcs above the axis are advances, and the gray arcs below the axis are retreats.

An arc diagram created from the same data as Charles Minard's famous Russian Campaign chart. Code: Examples/arc-8-minard.html.
D3 doesn't provide any generator function...


