This section will lead you through a complete SVG data-visualization application with D3. It's a larger example and more complex, but the concepts are the same, and most of the methods used were covered in this chapter. Each step is described briefly with some code examples, but you should download and try running the full listings available in the StepByStep/ folder from the GitHub repository for this chapter.
A complete step-by-step example
What are we going to create?
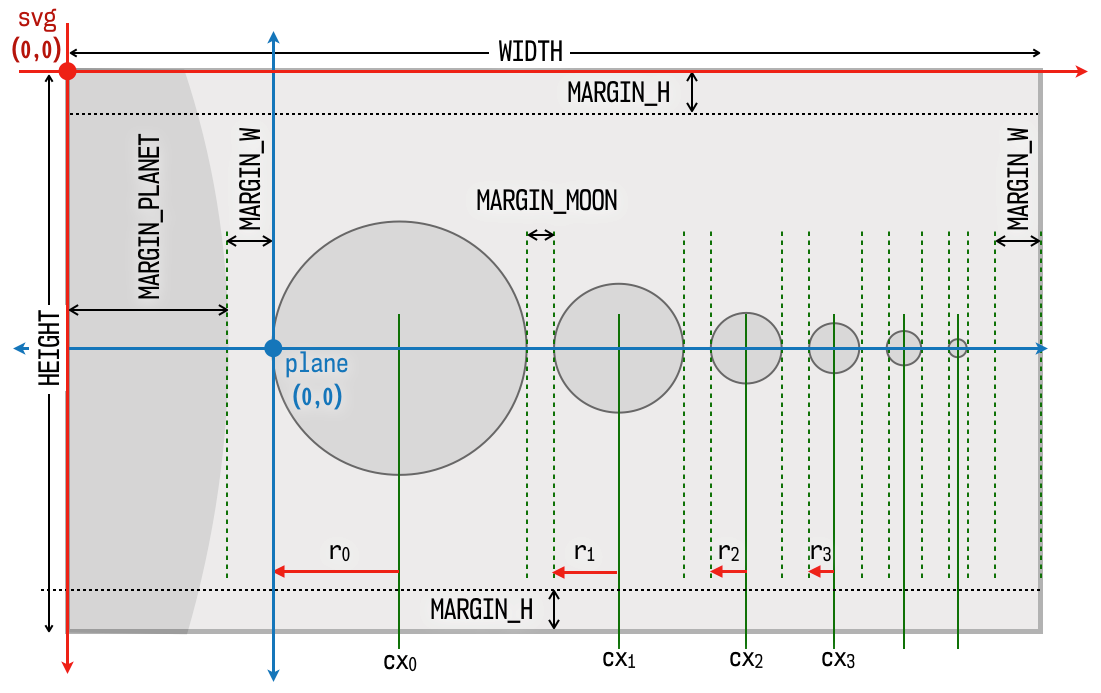
The following diagram is a sketch of the visualization we plan to create, showing the coordinates, spacing, and margins we will have to consider when drawing the shapes:

Sketch of the visualization that will be created
The page consists of six views...


