Search icon CANCEL
Subscription
0
Cart icon
Your Cart (0 item)
Close icon
You have no products in your basket yet
Save more on your purchases! discount-offer-chevron-icon
Savings automatically calculated. No voucher code required.
Arrow left icon
Explore Products
Best Sellers
New Releases
Books
Videos
Audiobooks
Learning Hub
Newsletter Hub
Free Learning
Arrow right icon
Arrow up icon
GO TO TOP
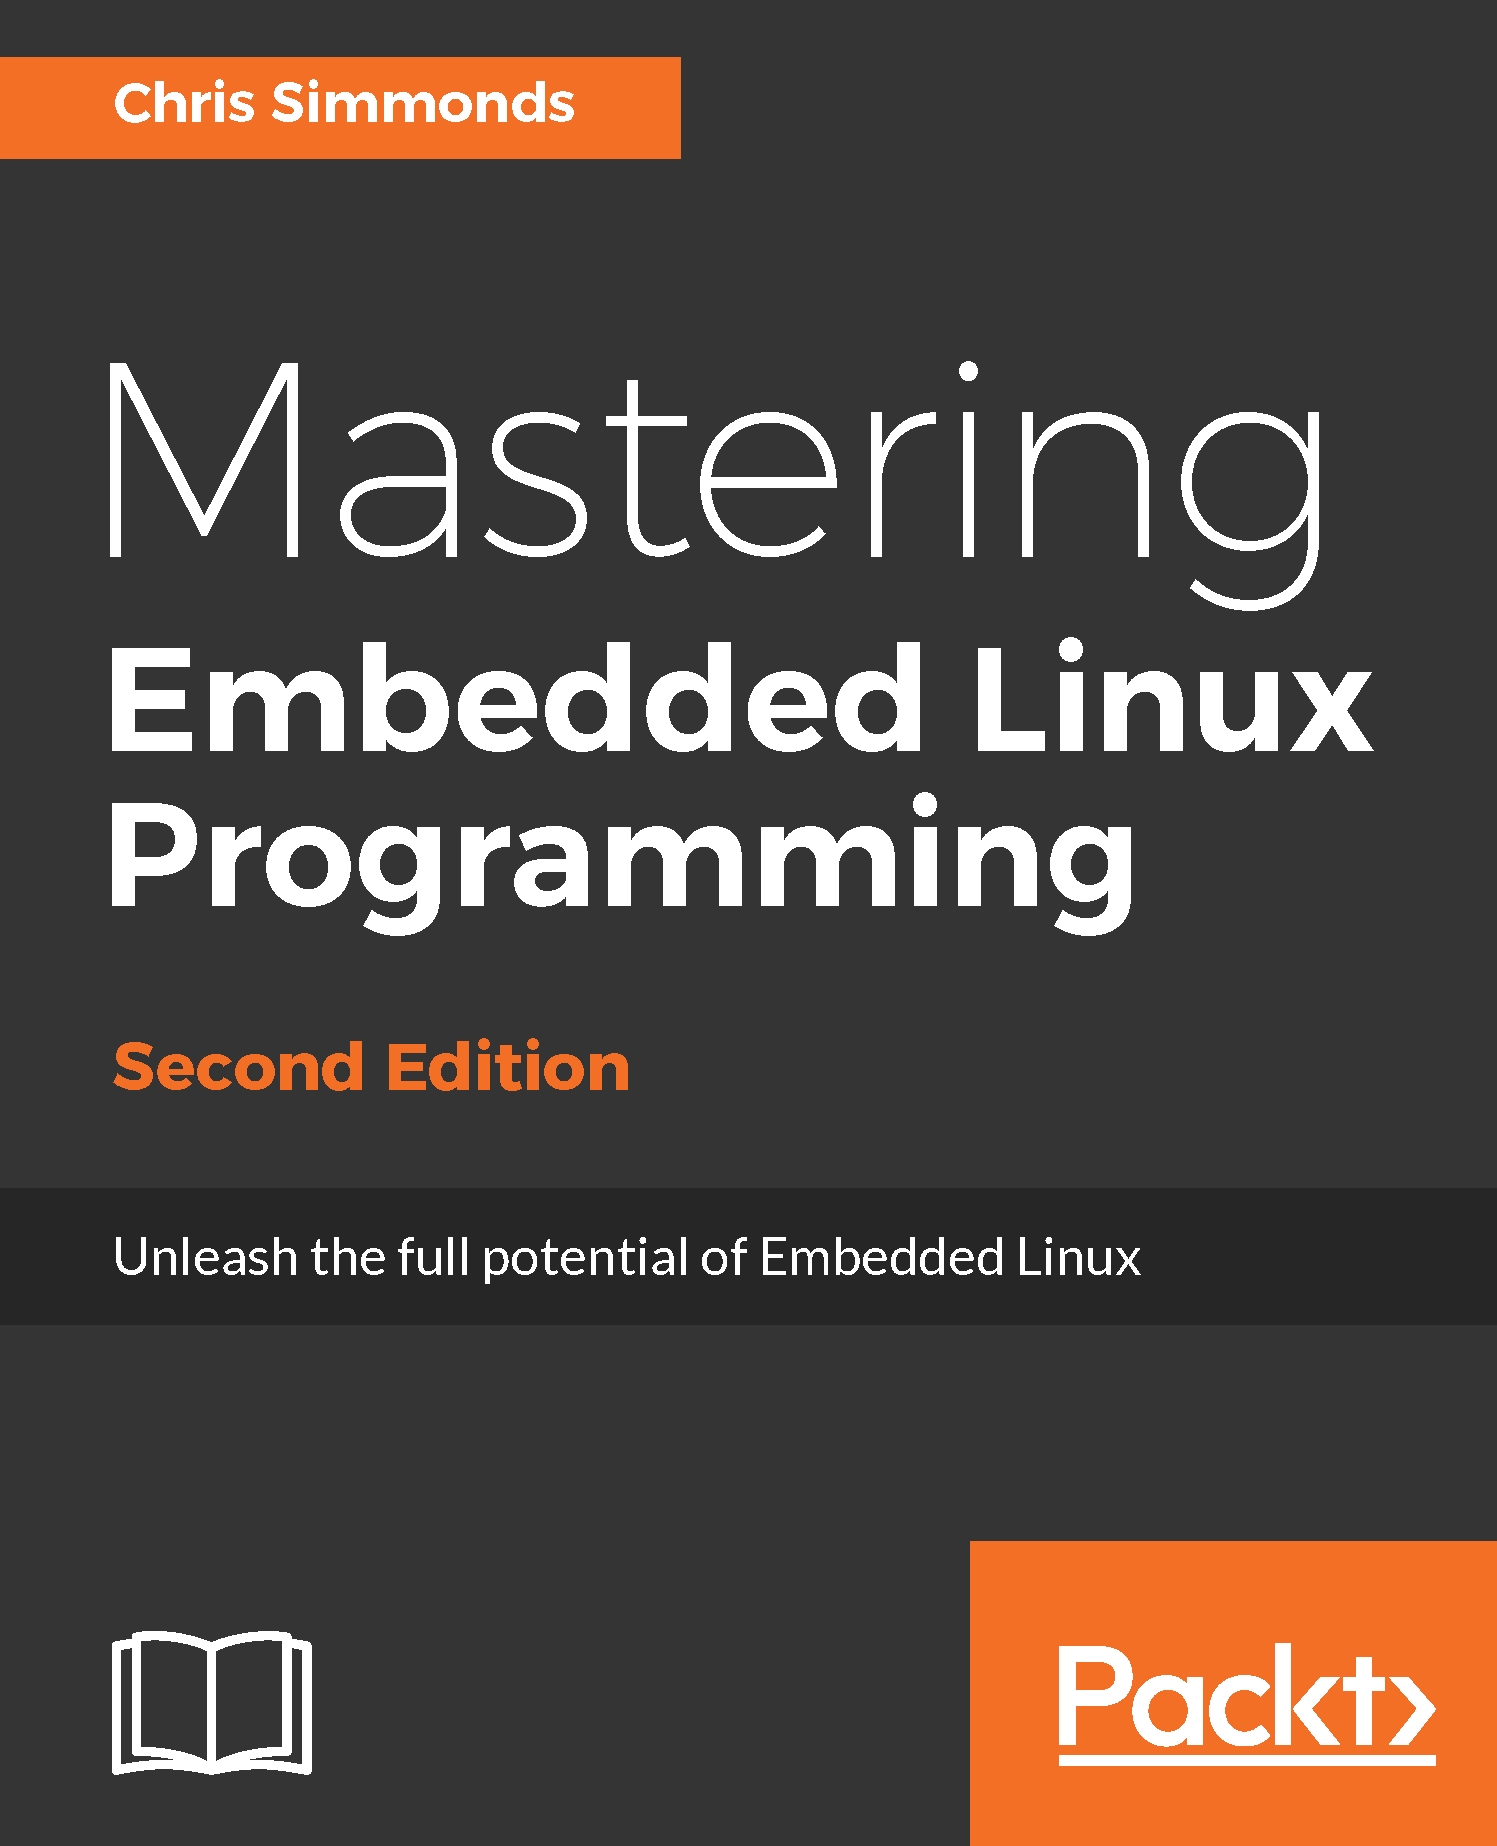
Mastering Embedded Linux Programming

You're reading from   Mastering Embedded Linux Programming Unleash the full potential of Embedded Linux with Linux 4.9 and Yocto Project 2.2 (Morty) Updates

Arrow left icon
Product type Paperback
Published in Jun 2017
Publisher Packt
ISBN-13 9781787283282
Length 478 pages
Edition 2nd Edition
Tools
Arrow right icon
Author (1):
Arrow left icon
Mr. Chris Simmonds Mr. Chris Simmonds
Author Profile Icon Mr. Chris Simmonds
Mr. Chris Simmonds
Arrow right icon
View More author details
Toc

Table of Contents (17) Chapters Close

Preface 1. Starting Out FREE CHAPTER 2. Learning About Toolchains 3. All About Bootloaders 4. Configuring and Building the Kernel 5. Building a Root Filesystem 6. Selecting a Build System 7. Creating a Storage Strategy 8. Updating Software in the Field 9. Interfacing with Device Drivers 10. Starting Up – The init Program 11. Managing Power 12. Learning About Processes and Threads 13. Managing Memory 14. Debugging with GDB 15. Profiling and Tracing 16. Real-Time Programming

Poor man's profiler

You can profile an application just by using GDB to stop it at arbitrary intervals to see what it is doing. This is the poor man's profiler. It is easy to set up and is one way of gathering profile data.

The procedure is simple:

  1. Attach to the process using gdbserver (for a remote debug) or GDB (for a native debug). The process stops.
  2. Observe the function it stopped in. You can use the backtrace GDB command to see the call stack.
  3. Type continue so that the program resumes.
  4. After a while, type Ctrl + C to stop it again, and go back to step 2.

If you repeat steps 2 to 4 several times, you will quickly get an idea of whether it is looping or making progress, and if you repeat them often enough, you will get an idea of where the hot spots in the code are.

There is a whole web page dedicated to the idea at http://poormansprofiler.org, together with scripts...

lock icon The rest of the chapter is locked
Register for a free Packt account to unlock a world of extra content!
A free Packt account unlocks extra newsletters, articles, discounted offers, and much more. Start advancing your knowledge today.
Unlock this book and the full library FREE for 7 days
Get unlimited access to 7000+ expert-authored eBooks and videos courses covering every tech area you can think of
Renews at $19.99/month. Cancel anytime
Banner background image