


Prophet
Prophet was developed internally at Facebook by Sean J. Taylor and Ben Letham in order to overcome two issues often encountered with other forecasting methodologies: the more automatic forecasting tools available tended to be too inflexible and unable to accommodate additional assumptions, and the more robust forecasting tools would require an experienced analyst with specialized data science skills. Facebook was experiencing too much demand for high-quality business forecasts than their analysts were able to provide. In 2017, Facebook released Prophet to the public as open source software.
Prophet was designed to optimally handle business forecasting tasks, which typically feature any of these attributes:
- Time series data captured at the hourly, daily, or weekly level with ideally at least a full year of historical data
- Strong seasonality effects occurring daily, weekly, and/or yearly
- Holidays and other special one-time events that don't necessarily follow the seasonality patterns but occur irregularly
- Missing data and outliers
- Significant trend changes that may occur with the launch of new features or products, for example
- Trends that asymptotically approach an upper or lower bound
Out of the box, Prophet typically produces very high-quality forecasts. But it is also very customizable and approachable by data analysts with no prior expertise in time series data. As you'll see in later chapters, tuning a Prophet model is very intuitive.
Essentially, Prophet is an additive regression model. This means that the model is simply the sum of several (optional) components, such as the following:
- A linear or logistic growth trend curve
- An annual seasonality curve
- A weekly seasonality curve
- A daily seasonality curve
- Holidays and other special events
- Additional user-specified seasonality curves, such as hourly or quarterly, for example
To take a concrete example, let's say we are modeling the sales of a small online retail store over four years, from January 1, 2000, through the end of 2003. We observe that the overall trend is constantly increasing over time from 1000 sales per day to around 1800 at the end of the time period. We also see that sales in spring are about 50 units above average and sales in autumn are about 50 units below average. Weekly, sales tend to be lowest on Tuesday and increase throughout the week, peaking on Saturday. Finally, throughout the hours of the day, sales peak at noon and smoothly fall to their lowest at midnight. This is what those individual curves would look like (note the different x-axis scales on each chart):
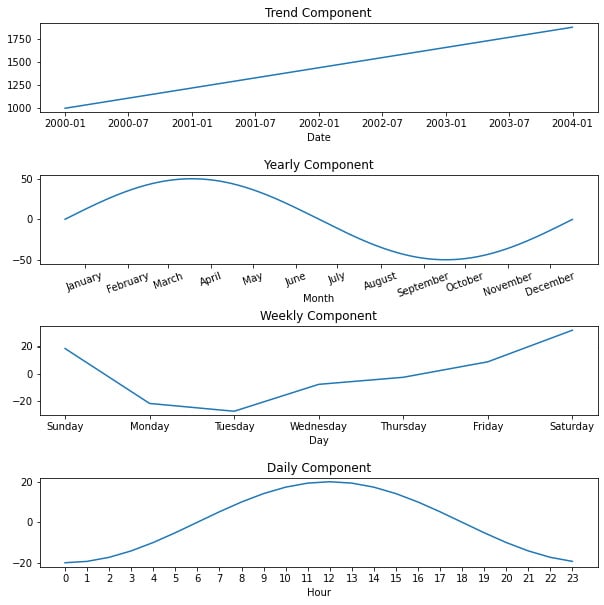
Figure 1.4 – Model components
An additive model would take those four curves and simply add them to each other to arrive at the final model for sales throughout the years. The final curve gets more and more complex as the sub-components are added up:
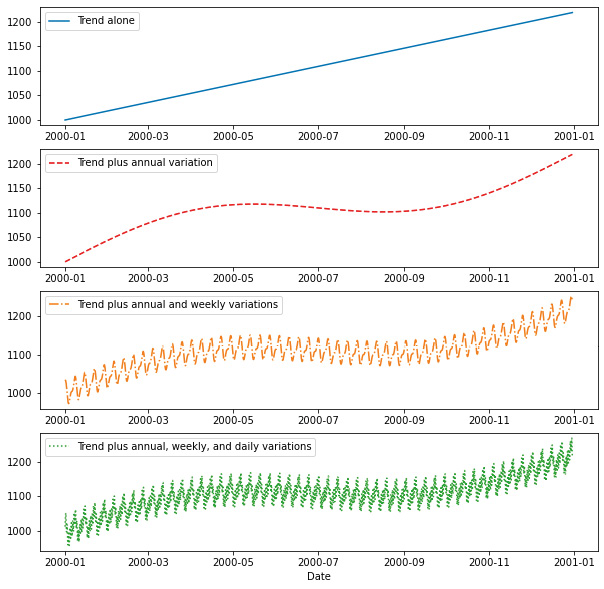
Figure 1.5 – Additive model
This preceding plot displays just the first year to better see the weekly and daily variations, but the full curve extends for 4 years.
Under the hood, Prophet is written in Stan, a probabilistic programming language (see the home page at https://mc-stan.org/ for more information about Stan). This has several advantages. It allows Prophet to optimize the fit process so that it typically completes in under a second. Stan is also compatible with both Python and R, so the Prophet team is able to share the same core fitting procedure between both language implementations. Also, by using Bayesian statistics, Stan allows Prophet to create uncertainty intervals for future predictions to add a data-driven estimate of forecasting risk.
Prophet manages to achieve typical results just as good as the more complicated forecasting techniques but with just a fraction of the effort. It has something for everyone. The beginner can build a highly accurate model in just a few lines of code without necessarily understanding the details of how everything works, while the expert can dig deep into the model, adding more features and tweaking hyperparameters to eke out incrementally better performance.


