Search icon CANCEL
Subscription
0
Cart icon
Close icon
You have no products in your basket yet
Save more on your purchases!
Savings automatically calculated. No voucher code required
Arrow left icon
All Products
Best Sellers
New Releases
Books
Videos
Audiobooks
Learning Hub
Newsletters
Free Learning
Arrow right icon
Metabase Up and Running

You're reading from  Metabase Up and Running

Product type Book
Published in Sep 2020
Publisher Packt
ISBN-13 9781800202313
Pages 332 pages
Edition 1st Edition
Languages
Author (1):
Tim Abraham Tim Abraham
Profile icon Tim Abraham

Table of Contents (15) Chapters

Preface 1. Section 1: Installing and Deploying Metabase
2. Chapter 1: Overview of Metabase 3. Chapter 2: Deploying Metabase with AWS 4. Section 2: Setting Up Your Instance and Asking Questions of Your Data
5. Chapter 3: Setting Up Metabase 6. Chapter 4: Connecting to Databases 7. Chapter 5: Building Your Data Model 8. Chapter 6: Creating Questions 9. Chapter 7: Creating Visualizations 10. Chapter 8: Creating Dashboards, Pulses, and Collections 11. Chapter 9: Using the SQL Console 12. Section 3: Advanced Functionality and Paid Features
13. Chapter 10: Advanced Features, Getting Help, and Contributing 14. Other Books You May Enjoy

Monitoring app performance

On the Elastic Beanstalk dashboard, we can see the overall health of our environment. Most of the time it should have the green checkmark, as in Figure 2.11. If you deploy using the smaller t2.micro EC2 instances, it may occasionally be in the Warning state (although I've noticed the actual app works fine in those cases):
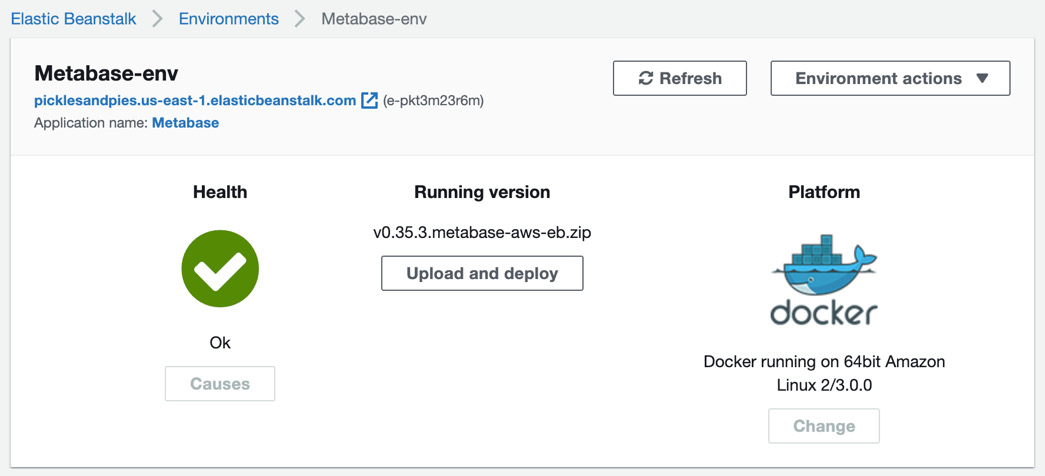
Figure 2.12 -

Figure 2.12 -

In addition to the overall health check, we can drill into specific performance-related statistics around the resources we've deployed. Let's learn how to do that.

From the Elastic Beanstalk dashboard, click Monitoring on the left rail. This will bring up the performance monitoring overview, where you can view several high-level statistics about your app.

Rather than going over all the statistics presented on the dashboard, let's just learn how to create a chart of the average NetworkOut for our EC2 Instances. Recall that in the Scaling Triggers section of our environment...

lock icon The rest of the chapter is locked
Register for a free Packt account to unlock a world of extra content!
A free Packt account unlocks extra newsletters, articles, discounted offers, and much more. Start advancing your knowledge today.
Unlock this book and the full library FREE for 7 days
Get unlimited access to 7000+ expert-authored eBooks and videos courses covering every tech area you can think of
Renews at €14.99/month. Cancel anytime}