Search icon CANCEL
Subscription
0
Cart icon
Close icon
You have no products in your basket yet
Save more on your purchases!
Savings automatically calculated. No voucher code required
Arrow left icon
All Products
Best Sellers
New Releases
Books
Videos
Audiobooks
Learning Hub
Newsletters
Free Learning
Arrow right icon
Learning Highcharts 4

You're reading from  Learning Highcharts 4

Product type Book
Published in Jan 2015
Publisher Packt
ISBN-13 9781783287451
Pages 478 pages
Edition 1st Edition
Languages
Author (1):
Joe Kuan Joe Kuan
Profile icon Joe Kuan

Table of Contents (23) Chapters

Learning Highcharts 4
Credits
About the Author
Acknowledgments
About the Reviewers
www.PacktPub.com
Preface
1. Web Charts 2. Highcharts Configurations 3. Line, Area, and Scatter Charts 4. Bar and Column Charts 5. Pie Charts 6. Gauge, Polar, and Range Charts 7. Bubble, Box Plot, and Error Bar Charts 8. Waterfall, Funnel, Pyramid, and Heatmap Charts 9. 3D Charts 10. Highcharts APIs 11. Highcharts Events 12. Highcharts and jQuery Mobile 13. Highcharts and Ext JS 14. Server-side Highcharts 15. Highcharts Online Services and Plugins Index

Sketching an area chart


In this section, we are going to use our very first example and turn it into a more stylish graph (based on the design of a wind energy poster by Kristin Clute): an area spline chart. An area spline chart is generated using the combined properties of area and spline charts. The main data line is plotted as a spline curve and the region underneath the line is filled in a similar color with a gradient and opaque style:

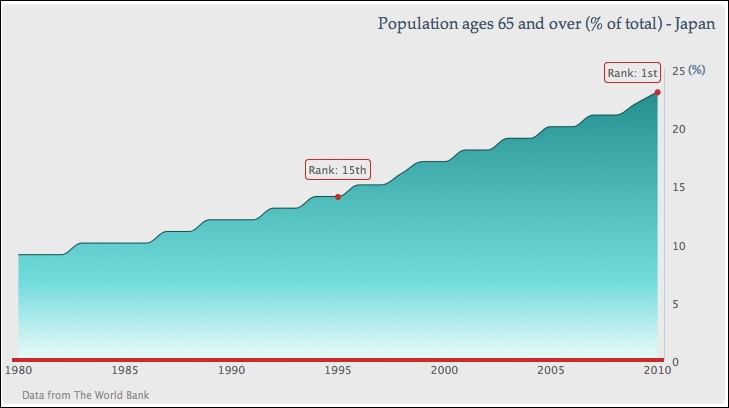
First, we want to make the graph easier for viewers to look up the values for the current trend, so we move the y-axis values to the right side of the chart, where they will be closest to the most recent year:

            yAxis: {  ....
                opposite: true
            }

The next thing is to remove the interval lines and have a thin axis line along the y axis:

          yAxis: { ....
              gridLineWidth: 0,
              lineWidth: 1,
          }

Then, we simplify the y-axis title with a percentage sign and align to the top of the axis:

 ...
lock icon The rest of the chapter is locked
Register for a free Packt account to unlock a world of extra content!
A free Packt account unlocks extra newsletters, articles, discounted offers, and much more. Start advancing your knowledge today.
Unlock this book and the full library FREE for 7 days
Get unlimited access to 7000+ expert-authored eBooks and videos courses covering every tech area you can think of
Renews at €14.99/month. Cancel anytime}