Search icon CANCEL
Subscription
0
Cart icon
Your Cart (0 item)
Close icon
You have no products in your basket yet
Arrow left icon
Explore Products
Best Sellers
New Releases
Books
Videos
Audiobooks
Learning Hub
Free Learning
Arrow right icon
Arrow up icon
GO TO TOP
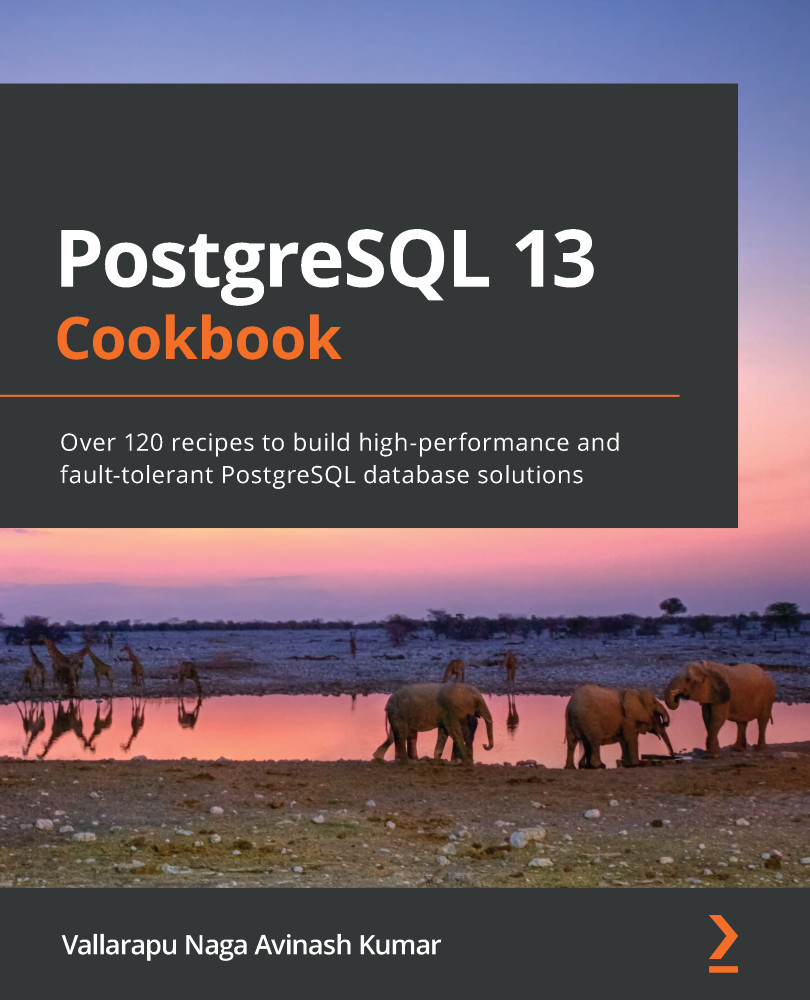
PostgreSQL 13 Cookbook

You're reading from   PostgreSQL 13 Cookbook Over 120 recipes to build high-performance and fault-tolerant PostgreSQL database solutions

Arrow left icon
Product type Paperback
Published in Feb 2021
Publisher Packt
ISBN-13 9781838648138
Length 344 pages
Edition 1st Edition
Languages
Concepts
Arrow right icon
Author (1):
Arrow left icon
Vallarapu Naga Avinash Kumar Vallarapu Naga Avinash Kumar
Author Profile Icon Vallarapu Naga Avinash Kumar
Vallarapu Naga Avinash Kumar
Arrow right icon
View More author details
Toc

Table of Contents (14) Chapters Close

Preface 1. Cluster Management Fundamentals 2. Cluster Management Techniques FREE CHAPTER 3. Backup and Recovery 4. Advanced Replication Techniques 5. High Availability and Automatic Failover 6. Connection Pooling and Load Balancing 7. Securing through Authentication 8. Logging and Analyzing PostgreSQL Servers 9. Critical Services Monitoring 10. Extensions and Performance Tuning 11. Upgrades and Patches 12. About Packt 13. Other Books You May Enjoy

Prometheus as a data source on the monitoring server

Grafana is used as a visualizer for metrics as graphs, tables, and so on. However, the data that is needed to visualize this information needs to be made available through a data source. This data source should contain all the time series diagnostic data of a PostgreSQL server. In this recipe, we shall discuss Prometheus, which is one of the famous data sources. We can use a simple query language called PromQL (Prometheus Query Language) to fetch the time series data stored in Prometheus. These queries will be used in panels on a Grafana dashboard to visualize the diagnostic data as graphs. We will now see the steps involved in installing and configuring Prometheus.

Getting ready

Prometheus can be installed on the same server as the Grafana server or another remote server. We need to make sure that we have sufficient storage available to store the time series data of all targets being monitored based on the data retention configured...

lock icon The rest of the chapter is locked
Register for a free Packt account to unlock a world of extra content!
A free Packt account unlocks extra newsletters, articles, discounted offers, and much more. Start advancing your knowledge today.
Unlock this book and the full library FREE for 7 days
Get unlimited access to 7000+ expert-authored eBooks and videos courses covering every tech area you can think of
Renews at $19.99/month. Cancel anytime
Banner background image