Installing and Using Power BI Report Builder
Power BI Report Builder is a separate, free report authoring tool that is part of the Microsoft Power BI software suite. Power BI Report Builder is the evolution of the venerable Report Builder tool, which allows users to create paginated reports (also known as traditional SQL Server Reporting Services or SSRS reports). Reports authored in Power BI Report Builder can be published to and viewed in the Power BI service, similarly to traditional Power BI Desktop reports.
Getting ready
To get ready for this recipe, first download the Power BI Report Builder installer from the following link: https://www.microsoft.com/en-us/download/details.aspx?id=105942.
Once on the page in your web browser, choose your language, and then click the Download button to download the PowerBiReportBuilder.msi file.
How to install Power BI Report Builder
To install Power BI Report Builder, follow these steps:
- Once
PowerBiReportBuilder.msiis downloaded, click Open file in your Downloads pane or run the file from your Downloads directory. - On the welcome page, click the Next button.
- Accept the license terms and click the Next button.
- Choose a Destination Folder or accept the default and click the Next button.
- Click the Install button.
- If prompted by User Account Control, click the Yes button.
- Once Power BI Report Builder is installed, click the Finish button.
Power BI Report Builder is now installed and ready to be used.
How it works
Unlike Power BI Desktop, which creates files with a PBIX extension, Power BI Report Builder saves report files as Report Definition Language (.rdl) files. RDL files are actually eXtensible Markup Language (XLM) files, and this is the same file format used by SQL Server Reporting Services (SSRS). Power BI Report Builder files can be published to either the Power BI service or Power BI Report Server, which is the successor to SQL Server Reporting Services.
Paginated reports operate quite differently than Power BI Desktop reports. Paginated reports are optimized for printing and enable the display of long tables or matrixes that span many report pages. This is different from how Power BI Desktop can only display a limited number of rows without scrolling.
Another key difference is that paginated reports have limited interactivity features compared with Power BI Desktop reports. In Power BI Desktop, clicking on visuals can influence and change the display of other visuals on a page. Paginated reports do not have such interactivity between visuals. Interactivity with paginated reports is done via Parameters, which function like Slicers in Power BI Desktop reports.
A final key differentiator between paginated reports and Power BI Desktop reports is that there are only a limited number of visuals, ~12 available for paginated reports, versus the dozens of default visuals available in Power BI Desktop and the hundreds of custom visuals available from AppSource.
To run Power BI Report Builder, start typing Power BI Report Builder in the Windows search bar, and then run the Power BI Report Builder app in the Windows Start menu. Next, follow these steps:
- On the Getting Started window, select New Report and then Table or Matrix Wizard.
- Make sure that the Create a dataset radio button is selected, and then click the Next button.
- Click the New… button to start creating a new dataset.
- In the Data Source Properties window, click the Build… button.
- On the Connection Properties pane, type
localhostor the name of your local computer for Server name. Depending on your circumstance, you may also need to include your SQL instance name in the form “server\instance”. TypeAdventureWorksDW2022or enter another database name. - You can test the connection using the Test Connection button, and if successful, click the OK button.
- Back on the Data Source Properties window, click the OK button.
- On the New Table or Matrix window, click the Next button.
- In the Database view pane, select the
FactInternetSalestable, and then click the Next button. - Drag the
SalesAmountfield into the Values field and theDueDatefield into the Row groups field, and then click the Next button. - On the next window, click the Next button once again.
- Finally, click the Finish >> button.
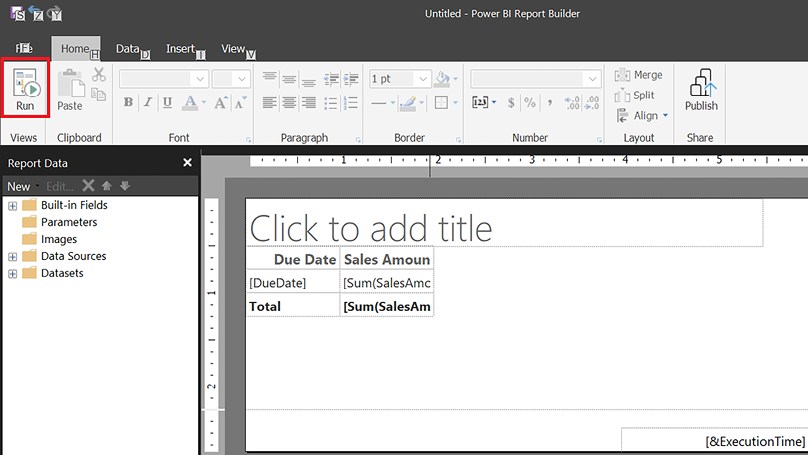
- The report should now look like Figure 1.19.

Figure 1.19: Simple paginated report
- Click the Run button to display the report.
Notice at the top of the displayed report that you can navigate through the multiple pages of the report, using the page navigation buttons within the Navigation section of the ribbon.
The Design button has replaced the Run button in the ribbon. Click the Design button and observe the Publish button on the far right of the ribbon, as shown in Figure 1.19. Clicking the Publish button prompts you to Sign in to the Power BI service.
See also
For additional information on the topics covered in this recipe, refer to the following links:
- What is Power BI Premium?: https://bit.ly/3QY3J0L
- What is Power BI embedded analytics?: https://bit.ly/3QY4fgg


