Search icon CANCEL
Subscription
0
Cart icon
Your Cart (0 item)
Close icon
You have no products in your basket yet
Arrow left icon
Explore Products
Best Sellers
New Releases
Books
Videos
Audiobooks
Learning Hub
Conferences
Free Learning
Arrow right icon
Arrow up icon
GO TO TOP
Mastering TensorFlow 1.x

You're reading from   Mastering TensorFlow 1.x Advanced machine learning and deep learning concepts using TensorFlow 1.x and Keras

Arrow left icon
Product type Paperback
Published in Jan 2018
Publisher Packt
ISBN-13 9781788292061
Length 474 pages
Edition 1st Edition
Languages
Tools
Arrow right icon
Toc

Table of Contents (21) Chapters Close

Preface 1. TensorFlow 101 FREE CHAPTER 2. High-Level Libraries for TensorFlow 3. Keras 101 4. Classical Machine Learning with TensorFlow 5. Neural Networks and MLP with TensorFlow and Keras 6. RNN with TensorFlow and Keras 7. RNN for Time Series Data with TensorFlow and Keras 8. RNN for Text Data with TensorFlow and Keras 9. CNN with TensorFlow and Keras 10. Autoencoder with TensorFlow and Keras 11. TensorFlow Models in Production with TF Serving 12. Transfer Learning and Pre-Trained Models 13. Deep Reinforcement Learning 14. Generative Adversarial Networks 15. Distributed Models with TensorFlow Clusters 16. TensorFlow Models on Mobile and Embedded Platforms 17. TensorFlow and Keras in R 18. Debugging TensorFlow Models 19. Tensor Processing Units
20. Other Books You May Enjoy

TensorBoard

The complexity of a computation graph gets high even for moderately sized problems. Large computational graphs that represent complex machine learning models can become quite confusing and hard to understand. Visualization helps in easy understanding and interpretation of computation graphs, and thus accelerates the debugging and optimizations of TensorFlow programs. TensorFlow comes with a built-in tool that allows us to visualize computation graphs, namely, TensorBoard.

TensorBoard visualizes computation graph structure, provides statistical analysis and plots the values captured as summaries during the execution of computation graphs. Let's see how it works in practice.

A TensorBoard minimal example

  1. Start by defining the variables and placeholders for our linear model:
# Assume Linear Model y = w * x + b
# Define model parameters
w = tf.Variable([.3], name='w',dtype=tf.float32)
b = tf.Variable([-.3], name='b', dtype=tf.float32)
# Define model input and output
x = tf.placeholder(name='x',dtype=tf.float32)
y = w * x + b
  1. Initialize a session, and within the context of this session, do the following steps:
    • Initialize global variables
    • Create tf.summary.FileWriter that would create the output in the tflogs folder with the events from the default graph
    • Fetch the value of node y, effectively executing our linear model
with tf.Session() as tfs:
tfs.run(tf.global_variables_initializer())
writer=tf.summary.FileWriter('tflogs',tfs.graph)
print('run(y,{x:3}) : ', tfs.run(y,feed_dict={x:3}))
  1. We see the following output:
run(y,{x:3}) :  [ 0.60000002]

As the program executes, the logs are collected in the tflogs folder that would be used by TensorBoard for visualization. Open the command line interface, navigate to the folder from where you were running the ch-01_TensorFlow_101 notebook, and execute the following command:

tensorboard --logdir='tflogs'

You would see an output similar to this:

Starting TensorBoard b'47' at http://0.0.0.0:6006

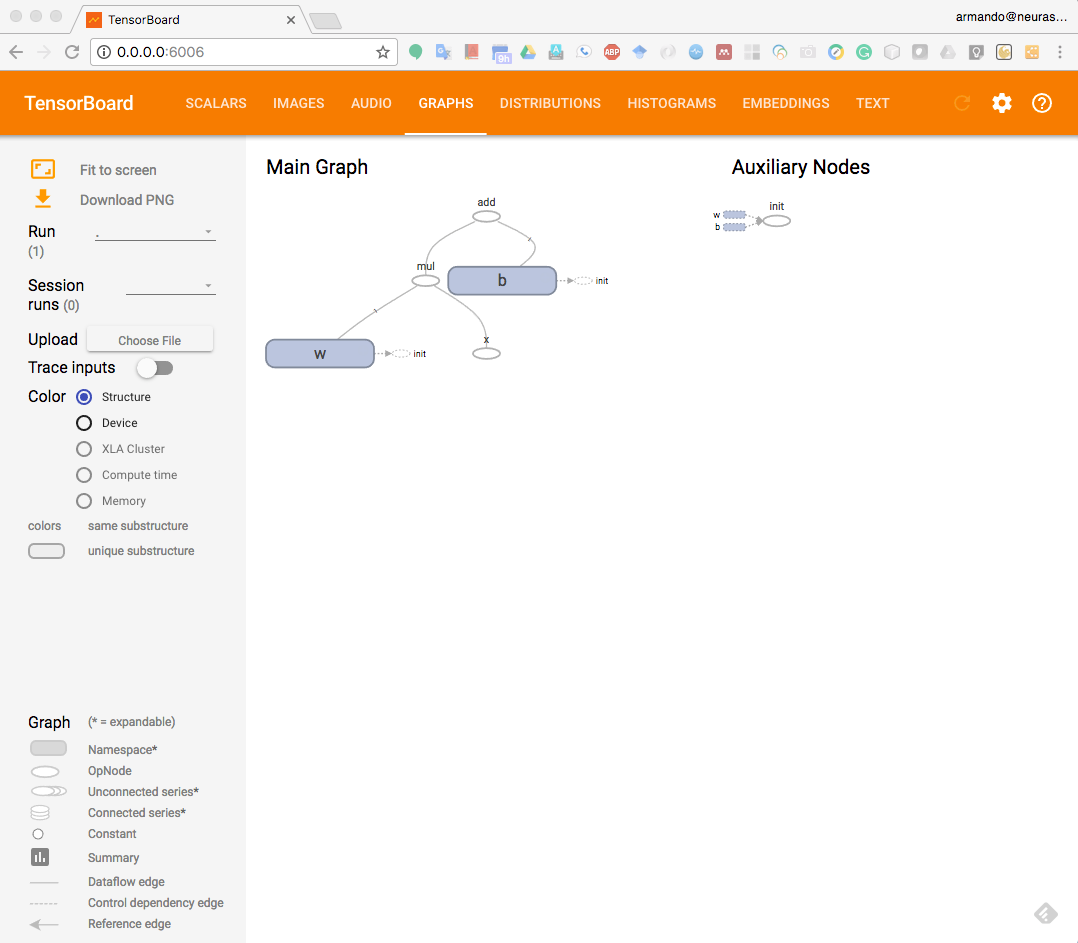
Open a browser and navigate to http://0.0.0.0:6006. Once you see the TensorBoard dashboard, don't worry about any errors or warnings shown and just click on the GRAPHS tab at the top. You will see the following screen:

TensorBoard console

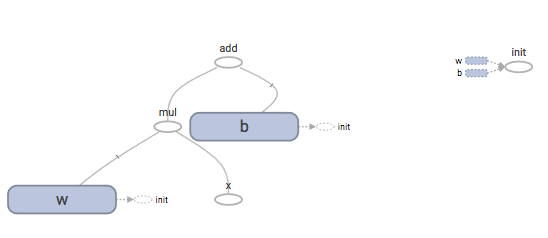
You can see that TensorBoard has visualized our first simple model as a computation graph:

Computation graph in TensorBoard

Let's now try to understand how TensorBoard works in detail.

TensorBoard details

TensorBoard works by reading log files generated by TensorFlow. Thus, we need to modify the programming model defined here to incorporate additional operation nodes that would produce the information in the logs that we want to visualize using TensorBoard. The programming model or the flow of programs with TensorBoard can be generally stated as follows:

  1. Create the computational graph as usual.
  2. Create summary nodes. Attach summary operations from the tf.summary package to the nodes that output the values that you wish to collect and analyze.
  3. Run the summary nodes along with running your model nodes. Generally, you would use the convenience function, tf.summary.merge_all(), to merge all the summary nodes into one summary node. Then executing this merged node would basically execute all the summary nodes. The merged summary node produces a serialized Summary ProtocolBuffers object containing the union of all the summaries.
  1. Write the event logs to disk by passing the Summary ProtocolBuffers object to a tf.summary.FileWriter object.
  2. Start TensorBoard and analyze the visualized data.

In this section, we did not create summary nodes but used TensorBoard in a very simple way. We will cover the advanced usage of TensorBoard later in this book.

You have been reading a chapter from
Mastering TensorFlow 1.x
Published in: Jan 2018
Publisher: Packt
ISBN-13: 9781788292061
Register for a free Packt account to unlock a world of extra content!
A free Packt account unlocks extra newsletters, articles, discounted offers, and much more. Start advancing your knowledge today.
Unlock this book and the full library FREE for 7 days
Get unlimited access to 7000+ expert-authored eBooks and videos courses covering every tech area you can think of
Renews at $19.99/month. Cancel anytime
Banner background image