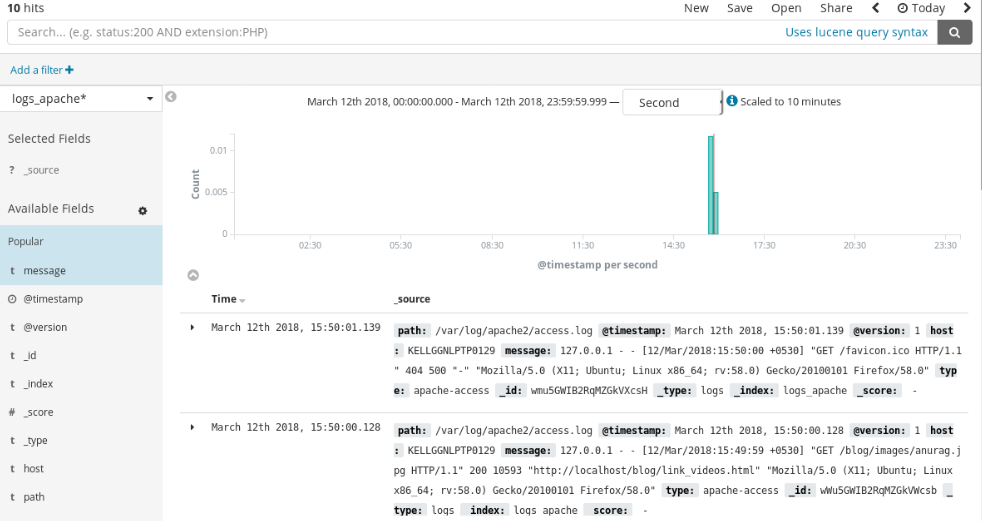
In Kibana, we have a Discover link on the left-hand side menu to discover our data. After configuring the Elasticsearch index, we can click on the Discover link, which will open the following screen:

In the preceding screen, we can see our data in tabular format with Time and _source. Time shows the exact date and time of data insertion in Elasticsearch and _source shows data in JSON format. In each row of data, we have an icon in front of the date and time to expand the view. When we expand the row, it shows us the following two tabs:
- Table: This is used to show the data in tabular format
- JSON: This is used to show the data in JSON format
Apart from the tab, there are two buttons, which are as follows:
- View surrounding documents: By default, it shows five surrounding documents along with the selected document
- View single document: This button...


