Search icon CANCEL
Subscription
0
Cart icon
Your Cart (0 item)
Close icon
You have no products in your basket yet
Arrow left icon
Explore Products
Best Sellers
New Releases
Books
Videos
Audiobooks
Learning Hub
Conferences
Free Learning
Arrow right icon
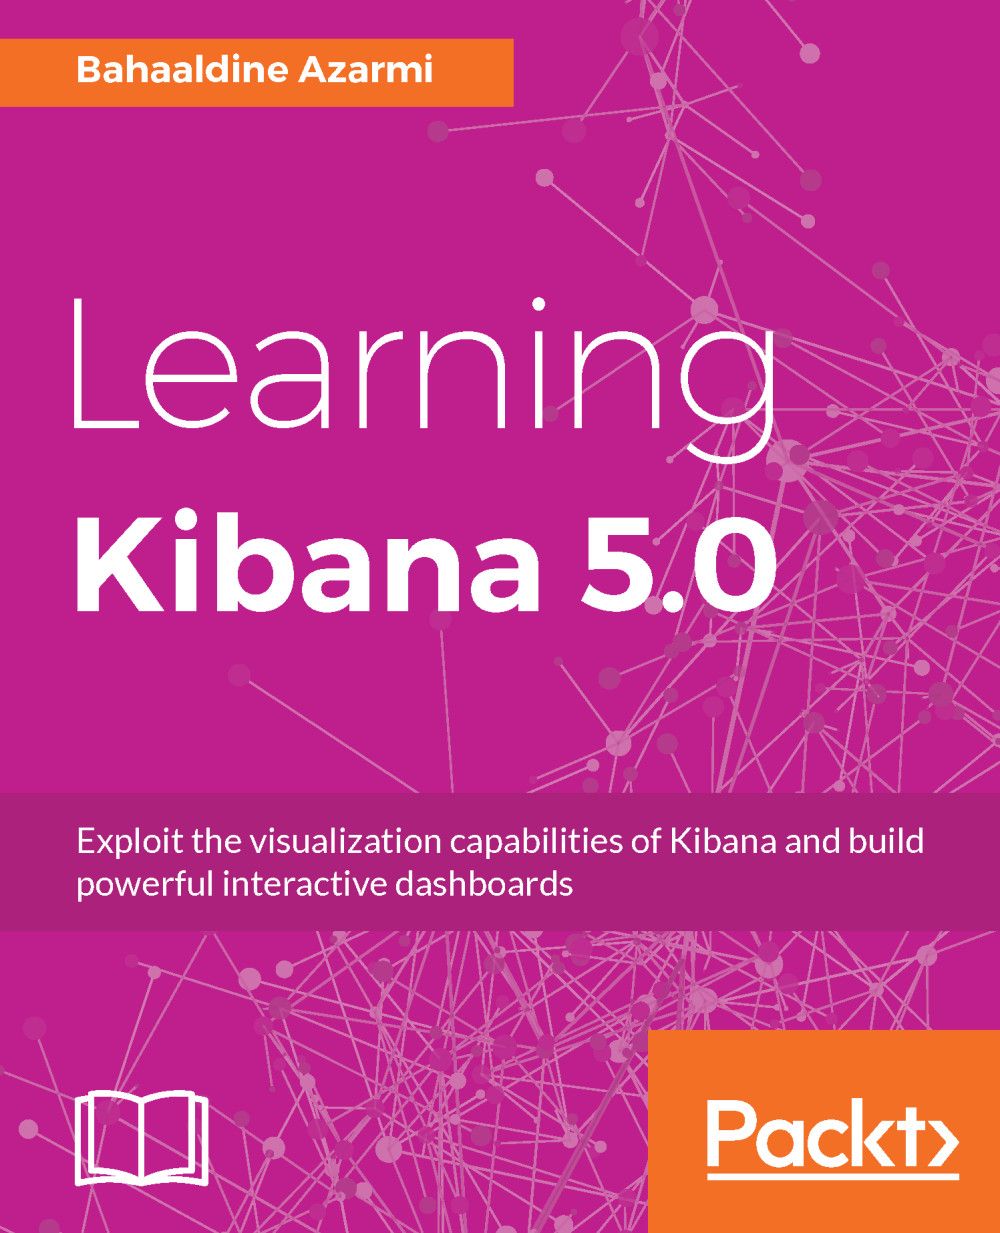
Learning Kibana 5.0
Learning Kibana 5.0

Learning Kibana 5.0: Exploit the visualization capabilities of Kibana and build powerful interactive dashboards

eBook
€8.99 €26.99
Paperback
€32.99
Subscription
Free Trial
Renews at €18.99p/m

What do you get with Print?

Product feature icon Instant access to your digital eBook copy whilst your Print order is Shipped
Product feature icon Paperback book shipped to your preferred address
Product feature icon Download this book in EPUB and PDF formats
Product feature icon Access this title in our online reader with advanced features
Product feature icon DRM FREE - Read whenever, wherever and however you want
OR
Modal Close icon
Payment Processing...
tick Completed

Shipping Address

Billing Address

Shipping Methods
Table of content icon View table of contents Preview book icon Preview Book

Learning Kibana 5.0

Chapter 1. Introduction to Data-Driven Architecture

If you are reading this book, it certainly means that you and I have something in common: we are both looking for a solution to effectively visualize and understand our data.

Data can be anything: business data, infrastructure data, accounting data, numbers, strings, structured, or unstructured. In any case, all organizations reach a point where trying to understand data and extract the value of it begins to be a real challenge, for different reasons:

  • Data brings complexity: If we take the example of an e-commerce IT operation team where one must find why the orders just dropped, it can be a very tricky process to go to the log to get the issue.
  • Data comes from a variety of sources: Infrastructure, applications, devices, legacy systems, databases, and so on. Most of the time, you need to correlate them. In the e-commerce example, maybe the drop is due to an issue in my database?
  • Data increases at a very fast pace: Data growth implies some new questions, such as which data should I keep? Or how do I scale my data management infrastructure?

The good news is that you won't need to learn it the hard way, as I'll try in this book to explain how I've tackled data analytics projects for different use cases and for different types of data based on my experience.

The other good news is that I'm part of the Solutions Architecture (SA) team at Elastic, and guess what? We'll use the Elastic stack. By being part of the SA team, I'm involved in a variety of use cases, from small to large scale, with different industries; the main goal is always to give to our users better management of and access to their data, and a better way to understand their data.

In this book, we'll dig into the use of Kibana, the data analytics layer of the Elastic stack. Kibana is the data visualization layer used in an overall data-driven architecture.

But what is data-driven architecture? This is the concept I will illustrate in this chapter by going through industry challenges, the usual technology used to answer this need, and then we'll go into the description of the Elastic stack.

Industry challenges

Depending on the industry, the use cases can be very different in term of data usage. Within a given industry, data is used in different ways for different purposes, whether it's for security analytics or order management.

Data comes in various formats and different scales of volumes. In the telecommunications industry, it's very common to see a project about the quality of services where data is grabbed from 100,000 network devices.

In every case, it always comes down to the same canonical issues:

  • How to decrease the complexity of handling fast growing data at scale
  • How to enable my organization to visualize data in the most effective and real-time fashion

By solving these fundamental issues, organizations would be allowed to simply recognize visual patterns without having to deal with the burden of exploring tons of data

To help you get a better understanding of the actual challenges, we'll start by describing the common use cases met across industries and then see what technologies are used and their limits in addressing these challenges.

Use cases

Every application produces data, whether it be in daily life when you use your favorite map application to geo-locate yourself and the best restaurant around you; or be it in IT organizations, with the different technical layers involved in building recommendations depending on your location and profile.

All computers and the processes and applications running on them are continuously producing data, effectively capturing the state of the system "now", driven by a CPU tick or user click.

This data normally stays in obscure files, located physically on the computer and hidden deep within data centers. We need a means to extract this data (ship), convert it from obscure data formats (transform), and eventually store it for centralized access.

This flow of data streaming in the system, based on event triggering functional processes, needs a proper architecture to be shipped, transformed, stored, and accessed in a scalable and distributed way.

The way we interact with applications dramatically changed the legacy architecture paradigm that we used to lay out. It's not anymore about building relational databases, it's about spin up on demand distributed data stores based on the throughput; it's not only about having batch processing data overnight, but it's also about pushing data processing to boundaries that weren't met so far in terms of real-time and machine learning aspects; it's not anymore about relying on heavy business intelligence tools to build reporting, but more about an iterative approach to data visualization close to real-time insights.

End users, driven by the need to process increasingly higher volumes of data, while maintaining real-time query responses, have turned away from more traditional, relational database or data warehousing solutions, due to poor scalability or performance. The solution is increasingly found in highly distributed, clustered data stores that can easily be.

Take the example of application monitoring, which is one of the most common use cases we meet across industries. Each application logs data, sometimes in a centralized way, for example by using syslog, and sometimes all the logs are spread out across the infrastructure, which makes it hard to have a single point of access to the data stream.

When an issue happens, or simply when you need to access the data, you might need to get:

  • The location: where the logs are stored.
  • The permission: can I access the logs? If not, who should I contact to get them?
  • The understanding of the log structure: I can take here the example of Tuxedo with multiline logs, which is not a trivial task at all.

The majority of large organizations don't retain logged data for longer than the duration of a log file rotation (a few hours or even minutes). This means that by the time an issue has occurred, the data which could provide the answers is lost.

When you actually have the data, what do you do? Well, there are different ways to extract the gist of logs. A lot of people start by using a simple string pattern search (GREP). Essentially, they try to find matching patterns in logs using a regular expression. That might work for a single log file but that doesn't scale as the log files rotate and you want to get insights over time, plus the fact that you may have more than one application and the need to make correlations.

Without any context regarding an issue (no time range, no application key, no insight), a user is reduced to brute force, assuming you are also looking in the correct file in the first place.

GREP is convenient, but clearly doesn't fit the need to react quickly to failure in order to reduce the Mean Time To Recovery (MTTR). Think about it: what if we are talking of a major issue on the purchase API of an e-commerce website? What if the users experience a high latency on this page or, worse, can't go to the end of the purchase process? The time you will spend trying to recover your application from gigabytes of logs is money you could potentially lose.

Another potential issue could be around a lack of security analytics and not being able to blacklist the IPs that try to brute force your application. In the same context, I've seen use cases where people didn't know that every night there was a group of IPs attempting to get into their system, and this was just because they were not able to visualize the IPs on a map and trigger alerts based on their value.

A simple, yet very effective, pattern in order to protect a system would have been to limit access to resources or services to the internal system only. The ability to whitelist access to a known set of IP addresses is essential.

The consequence could be dramatic if a proper data-driven architecture with a solid visualization layer is not serving those needs: lack of visibility and control, increasing the MTTR, customer dissatisfaction, financial impact, security leaks, and bad response time and user experience.

Fundamental steps

The objective is then to avoid these consequences, and build an architecture that will serve the different following aspects.

Data shipping

The architecture should be able to transport any kind of data/events, structured or unstructured; in other words, move data from remote machines to a centralized location. This is usually done by a lightweight agent deployed next to the data sources, on the same host, or on a distant host with regards to different aspects:

  • Lightweight, because ideally it shouldn't compete for resources with the process that generates the actual data, otherwise it could reduce the expected process performance
  • There are a lot of data shipping technologies out there; some of them are tight to a specific technology, others are based on an extensible framework which can adapt relatively to a data source
  • Shipping data is not only about sending data over the wire, it's also about security and being sure that the data is sent to the proper destination with an end-to-end secured pipeline.
  • Another aspect of data shipping is the management of data load. Shipping data should be done relative to the load that the end destination is able to ingest; this feature is called back pressure management

It's essential for data visualization to rely on reliable data shipping. Take as an example data flowing from financial trade machines and how critical it could be not to be able to detect a security leak just because you are losing data.

Data ingest

The scope of an ingest layer is to receive data, encompassing as wide a range of commonly used transport protocols and data formats as possible, while providing capabilities to extract and transform this data before finally storing it.

Processing data can somehow be seen as extracting, transforming, and loading (ETL) data, which is often called an ingestion pipeline and essentially receives data from the shipping layer to push it to a storage layer. It comes with the following features:

  • Generally, the ingestion layer has a pluggable architecture to ease integration with the various sources of data and destinations, with the help of a set of plugins. Some of the plugins are made for receiving data from shippers, which means that data is not always received from shippers and can directly come from a data source, such as a file, network, or even a database. It can be ambiguous in some cases: should I use a shipper or a pipeline to ingest data from the file? It will obviously depend on the use case and also on the expected SLAs.
  • The ingestion layer should be used to prepare the data by, for example, parsing the data, formatting the data, doing the correlation with other data sources, and normalizing and enriching the data before storage. This has many advantages, but the most important is that it can improve the quality of the data, providing better insights for visualization. Another advantage could be to remove processing overhead later on, by precomputing a value or looking up a reference. The drawback of this is that you may need to ingest the data again if the data is not properly formatted or enriched for visualization. Hopefully, there are some ways to process the data after it has been ingested.
  • Ingesting and transforming data consumes compute resources. It is essential that we consider this, usually in terms of maximum data throughput per unit, and plan to ingestion by distributing the load over multiple ingestion instances. This is a very important aspect of real-time visualization which is, to be precise, near real-time. If ingestion is spread across multiple instances, it can accelerate the storage of the data, and therefore make it available faster for visualization.

Storing data at scale

Storage is undoubtedly the masterpiece of the data-driven architecture. It provides the essential, long-term retention of your data. It also provides the core functionality to search, analyze, and discover insights in your data. It is the heart of the process. The action will depend on the nature of the technology. Here are some aspects that the storage layer usually brings:

  • Scalability is the main aspect, the storage used for various volumes of data which could start from GB, TB, to PB of data. The scalability is horizontal, which means that as the demand and volume grow, you should be able to increase the capacity of the storage seamlessly by adding more machines.
  • Most of the time, a non-relational and highly distributed data store, which allows fast data access and analysis at a high volume and on a variety of data types, is used, namely a NoSQL data store. Data is partitioned and spread over a set of machines, in order to balance the load while reading or writing data.
  • For data visualization, it's essential that the storage exposes an API to make analysis on top of the data. Letting the visualization layer do the statistical analysis, such as grouping data over a given dimension (aggregation), wouldn't scale.
  • The nature of the API depends on the expectation on the visualization layer, but most of the time it's about aggregations. The visualization should only render the result of the heavy lifting done at the storage level.
  • A data-driven architecture can serve data to a lot of different applications and users, and for different levels of SLAs. High availability becomes the norm in such architecture and, like scalability, it should be part of the nature of the solution.

Visualizing data

The visualization layer is the window on the data. It provides a set of tools to build live graphs and charts to bring the data to life, allowing you to build rich, insightful dashboards that answer the questions: What is happening now? Is my business healthy? What is the mood of the market?

The visualization layer in a data-driven architecture is one of the potential data consumers and is mostly focused on bringing KPIs on top of stored data. It comes with the following essential features:

  • It should be lightweight and only render the result of processing done in the storage layer
  • It allows the user to discover the data and get quick out-of-the box insights on the data
  • It brings a visual way to ask unexpected questions to the data, rather than having to implement the proper request to do that
  • In modern data architectures that must address the needs of accessing KPIs as fast as possible, the visualization layer should render the data in near real-time
  • The visualization framework should be extensible and allow users to customize the existing assets or to add new features depending on the needs
  • The user should be able to share the dashboards outside of the visualization application

As you can see, it's not only a matter of visualization. You need some foundations to reach the objectives.

This is how we'll address the use of Kibana in this book: we'll focus on use cases and see what is the best way to leverage Kibana features, depending on the use case and context.

The main differentiator with the other visualization tools is that Kibana comes along a full stack, the Elastic stack, with a seamless integration with every layer of the stack, which just eases the deployment of such architecture.

There are a lot of other technologies out there; we'll now see what they are good at and what their limits are.

Technologies limits

In this part, we'll try to analyze why some technologies can have limitations when trying to fulfill the expectations of a data-driven architecture.

Relational databases

I still come across people using relational databases to store their data in the context of a data-driven architecture; for example, in the use case of application monitoring, the logs are stored in MySQL. But when it comes to data visualization, it starts to break all the essential features we mentioned earlier:

  • A Relational Database Management System (RDBMS) only manages fixed schemas and is not designed to deal with dynamic data models and unstructured data. Any structural changes made on the data will need to update the schema/tables, which, as everybody knows, is expensive.
  • RDBMS doesn't allow real-time data access at scale. It wouldn't be realistic, for example, to create an index for each column for each table, for each schema in a RDBMS; but essentially that is what would be needed for real-time access.
  • Scalability is not the easiest thing for RDBMS; it can be a complex and heavy process to put in place and wouldn't scale against a data explosion.

RDBMS should be used as a source of data that can be used before ingestion time to correlate or enrich ingested data to have a better granularity in the visualized data.

Visualization is about providing users with the flexibility to create multiple views of the data, enabling them to explore and ask their own questions without predefining a schema or constructing a view in the storage layer.

Hadoop

The Hadoop ecosystem is pretty rich in terms of projects. It's often hard to pick or understand which project will fit the ones needed; if we step back, we can consider the following aspects that Hadoop fulfills:

  • It fits for massive-scale data architecture and will help to store and process any kind of data, for any level of volume
  • It has out of-the-box batch and streaming technologies that will help to process the data as it comes in to create an iterative view on top of the raw data, or longer processing for larger-scale views
  • The underlying architecture is made to make the integration of processing engines easy, so you can plug and process your data with a lot of different frameworks
  • It's made to implement the data lake paradigms where one will essentially drop its data in order to process it

But what about visualization? Well, there are tons of initiatives out there, but the problem is that none of them can go against the real nature of Hadoop, which doesn't help for real-time data visualization at scale:

  • Hadoop Distributed File System (HDFS) is a sequential read and write filesystem, which doesn't help for random access.
  • Even the interactive ad hoc query or the existing real-time API doesn't scale in terms of integration with the visualization application. Most of the time, the user has to export its data outside of Hadoop in order to visualize it; some visualizations claim to have a transparent integration with HDFS, whereas under the hood, the data is exported and loaded in the memory in batches, which make the user experience pretty heavy and slow.
  • Data visualization is all about APIs and easy access to the data, which Hadoop is not good at, as it always requires implementation from the user.

Hadoop is good for processing data, and is often used conjointly with other real-time technology, such as Elastic, to build Lambda architectures as shown in the following diagram:

Hadoop

Lambda architecture with Elastic as a serving layer

In this architecture, you can see that Hadoop aggregates incoming data either in a long processing zone or a near real-time zone. Finally, the results are indexed in Elasticsearch in order to be visualized in Kibana. This means essentially that one technology is not meant to replace the other, but that you can leverage the best of both.

NoSQL

There are a lot of different very performant and massively scalable NoSQL technologies out there, such as key value stores, document stores, and columnar stores, but most of them do not serve analytic APIs or don't come with an out-of-the box visualization application.

In most cases, the data that these technologies is using is ingested in an indexation engine such as Elasticsearch to provide analytics capabilities for visualization or search purposes.

With the fundamental layers that a data-driven architecture should have and the limits identified in existing technologies in the market, let's now introduce the Elastic stack, which essentially answers these shortcomings.

Overview of the Elastic stack

The Elastic stack, formerly called ELK, provides the different layers that are needed to implement a data-driven architecture.

It starts from the ingestion layer with Beats, Logstash, and the ES-Hadoop connector, to a distributed data store with Elasticsearch, and finally to visualization with Kibana, as shown in the following figure:

Overview of the Elastic stack

Elastic stack structure

As we can see in the diagram, Kibana is just one component of it.

In the following chapters, we'll focus in detail on how to use Kibana in different contexts, but we'll always need the other components. That's why you will need to understand the roles of each of them in this chapter.

One other important thing is that this book intends to describe how to use Kibana 5.0; thus, in this book, we'll use the Elastic stack 5.0.0 (https://www.elastic.co/blog/elastic-stack-5-0-0-released).

Elasticsearch

Elasticsearch is a distributed and scalable data store from which Kibana will pull out all the aggregation results that are used in the visualization. It's resilient by nature and is designed to scale out, which means that nodes can be added to an Elasticsearch cluster depending on the needs in a very simple way.

Elasticsearch is a highly available technology, which means that:

  • First, data is replicated across the cluster so in case of failure there is still at least one copy of the data
  • Secondly, thanks to its distributed nature, Elasticsearch can spread the indexing and searching load over the cluster nodes, to ensure service continuity and respect to your SLAs

It can deal with structured and unstructured data, and as we visualize data in Kibana, you will notice that data, or documents to use Elastic vocabulary, are indexed in the form of JSON documents. JSON makes it very handy to deal with complex data structures as it supports nested documents, arrays, and so on.

Elasticsearch is a developer-friendly solution and offers a large set of REST APIs to interact with the data, or the settings of the cluster itself. The documentation for these APIs can be found at https://www.elastic.co/guide/en/elasticsearch/reference/current/docs.html.

The parts that will be interesting for this book are mainly aggregations and graphs, which respectively will be used to make analytics on top of the indexed data (https://www.elastic.co/guide/en/elasticsearch/reference/current/search-aggregations.html) and create relations between documents (https://www.elastic.co/guide/en/graph/current/graph-api-rest.html).

On top of these APIs, there are also client APIs which allow Elasticsearch to be integrated with most technologies such as Java, Python, Go, and so on (https://www.elastic.co/guide/en/elasticsearch/client/index.html.).

Kibana generates the requests made to the cluster for each visualization. We'll see in this book how to dig into it and what features and APIs have been used.

The last main aspect for Elasticsearch is that it's a real-time technology that allows working with all ranges of volumes from gigabytes to petabytes, with the different APIs.

Besides Kibana, there are lot of different solutions that can leverage the open APIs that Elasticsearch offers to build visualization on top of the data; but Kibana is the only technology dedicated to it.

Beats

Beat is a lightweight data shipper which transports data from different sources such as applications, machines, or networks. Beats is built on top of libbeat, an open source library that allows every flavor of beat to send data to Elasticsearch, as illustrated in the following diagram:

Beats

Beats architecture

The diagram shows the following Beats:

  • Packetbeat, which essentially sniffs packets over the network wire for specific protocols such as MySQL and HTTP. It basically grabs all the fundamental metrics that will be used to monitor the protocol in question. For example, in the case of HTTP, it will get the request, the response, wrap into a document, and index it into Elasticsearch. We'll not use this beat in the book, as it would require a full book on it, so I encourage you to go on the following website to see what kind of Kibana dashboard you can build on top of it: http://demo.elastic.co.
  • Filebeat is meant to securely transport the content of a file from point A to point B like the tail command. We'll use this beat jointly with the new ingest node (https://www.elastic.co/guide/en/elasticsearch/reference/master/ingest.html) to push data from file directly to Elasticsearch, which will process the data before indexing it. The architecture can then be simplified, as shown in the following figure:

    Beats

    Ingestion pipeline without ingest

  • In the preceding diagram, the data is first shipped by Beats, then put into a message broker (we'll come back to this notion later in the book), processed by Logstash, before being indexed by Elasticsearch. The ingest node dramatically simplifies the architecture for the use case:

    Beats

    Ingestion pipeline with Ingest node

As the preceding diagrams show, the architecture is reduced to two components with filebeat and the ingest node. We'll be then able to visualize the content in Kibana.

  • Topbeat is the first kind of Metricbeat that allows us to ship machines or application execution metrics to Elasticsearch. We'll also use it later on in this book to ship our laptop data and visualize it in Kibana. The good thing here is that this Beat comes with pre-built templates which only need to be imported in Kibana, as the document generated by the Beat is standard.
  • There are a lot of different Beats made by the community that can be used for interesting data visualization. A list of them can be found at https://www.elastic.co/guide/en/beats/libbeat/current/index.html.

While Beats offer some basic filtering features, they don't provide the level of transformation that Logstash can bring.

Logstash

Logstash is a data processor that embraces the centralized data processing paradigm. It allows the users to collect, enrich/transform, and transport data to destinations with the help of more than 200 plugins, as shown in the following figure:

Logstash

Logstash, the processing pipeline

Logstash is capable of collecting data from any source including Beats as every Beat comes with an out-of-the box integration for Logstash. The separation of roles is clear here: while beats is responsible for shipping the data, Logstash allows for processing the data before indexation.

From a data visualization point of view, Logstash should be used in order to prepare the data; we will see, for example, later in this book that you could receive IP addresses in logs from which it might be useful to deduce a geo-location. This can be done with the new geoip plugin, which is available at:  https://www.elastic.co/guide/en/logstash/current/plugins-filters-geoip.html. This helps to get the following kind of visualization:

Logstash

IP address visualization on a map

We'll see in our use cases how data preparation is important to comply with the different available visualizations in Kibana.

Kibana

Kibana is the core product described in this book; it's where all the user interface actions happen. Most of the visualization technology handles the analytical processing, whereas Kibana is just a web application that renders analytical processing done by Elasticsearch. It doesn't load data from Elasticsearch and then process it, but leverages the power of Elasticsearch to do all the heavy lifting. This basically allows real-time visualization at scale: as the data grows, the Elasticsearch cluster is scaled relatively to offer the best latency depending on the SLAs.

Kibana provides the visual power to Elasticsearch aggregations, allowing you to slice through your time-series datasets, or segment your data fields, as easy as pie.

Kibana is fitted for time-based visualization, even if your data can come without any timestamp, and brings visualization made for rendering the Elasticsearch aggregation framework. The following screenshot shows an example of a dashboard built in Kibana:

Kibana

Kibana dashboard

As you can see, a dashboard contains one or more visualizations. We'll dig into them one by one in the context of our use cases. To build a dashboard, the user is brought into a data exploration experience where they will:

  • Discover its data by digging into the indexed document as the following screenshot shows:

    Kibana

    Discover data view

  • Build visualizations with the help of a comprehensive palette, based on the question the user has for the data:

    Kibana

    Kibana pie chart visualization

    The preceding visualization shows the vehicles involved in an accident in Paris. In the example, the first vehicle was a Car, the second a Motor Scooter, and the last one a Van. We will dig into the accidentology dataset in the logging use case.

  • Build an analytics experience by composing the different visualizations in a dashboard.

    The plugin structure of Kibana makes it infinitely extensible. You'll see that Kibana is not only made for analytics on top of your data, but also to monitor your Elastic stack, build relations between documents, and also to do metrics analytics:

    Kibana

    Kibana 5 plugin picker

X-Pack

Lastly I would like to introduce the concept of X-Pack, which will also be used in the book. While X-Pack is part of the subscription offer, one can download it on the Elastic website and use a trial license to evaluate it.

X-Pack is a set of plugins for Elasticsearch and Kibana that provides the following enterprise features.

Security

Security helps to secure the architecture at the data and access level. On the access side, the Elasticsearch cluster can be integrated with an LDAP, Active Directory, and PKI to enable role-based access on the cluster. There are additional ways to access it, either by what we call a native realm (https://www.elastic.co/guide/en/shield/current/native-realm.html), local to the cluster, or a custom realm (https://www.elastic.co/guide/en/shield/current/custom-realms.html), to integrate with other sources of authentication.

By adding role-based access to the cluster, users will only see data that they are allowed to see at the index level, document level, and field level.

From a data visualization point of view, this means, for example, that if a set of users are sharing data within the same index, but are for the first set only allowed to see French data, and for the other group only to see German data, they could both have a Kibana instance pointing to the index, but which, with the help of the underlying permissions configuration, renders the respective country data.

On the data side, the transport layer between Elasticsearch nodes can be encrypted. Transport can also be secured at the Elasticsearch and Kibana level, which means that the Kibana URL can be behind HTTPS.

Lastly, the security plugin provides IP filtering, but more importantly for data visualization, audit logging that tracks all the access to the cluster and can be easily rendered as a Kibana dashboard.

Monitoring

Monitoring is a Kibana plugin that gives insights on the infrastructure. While this was made primarily for Elasticsearch, Elastic is extending it for other parts of the architecture, such as Kibana or Logstash. That way, the users will have a single point of monitoring of all Elastic components and can track, for example, whether Kibana is executing properly, as shown in the following screenshot:

Monitoring

Kibana monitoring plugin

As you can see, users are able to see how many concurrent connections are made on Kibana, as well as deeper metrics such as the Event Loop Delay, which essentially represents the performance of the Kibana instance.

Alerting

If alerting is combined with monitoring data, it then enables proactive monitoring of both your Elasticinfra and your data. The alerting framework lets you describe queries to schedule and action in the background to define:

  • When you want to run the alert; in other words, to schedule the execution of the alert
  • What you want to watch by setting a condition that leverages Elasticsearch search, aggregations, and graph APIs
  • What you want to do when the watch is triggered: write the result in a file, in an index, send it by e-mail, or send it over HTTP

The watch states are also indexed in Elasticsearch, which allows visualization to see the life cycle of the watch. Typically, you would render a graph that monitors certain metrics and the related triggered watches as shown in the following diagram:

Alerting

Alerts shown on a visualization

The important aspect of the preceding visualization is that the user can see when the alerts have been triggered and how many of them, depending on a threshold.

We will use alerting later in this book in a metric analytics use case based on the performance of the CPU.

Graph

Graph is probably one of the most exciting features of the version 2.3 release at the beginning of 2016. It provides both an API and a plugin for visualization in Kibana, and brings the ability to build relations between documents indexed in Elasticsearch. Unlike what lots of users think, graph is not a graph database; it actually redefines what graph is and seeks for relevant relations between data based on a relevancy ranking, regardless of how the data has been modeled from the start.

Figuring out the frequency of a term in the background dataset is what the search engines naturally understand when they do relevancy ranking; they know how common a word is.

When we throw terms in the Elasticsearch indices, it naturally knows which things are the most interesting, and this logic is applied to the graph.

The easiest way to use graph is to start in Kibana with the help of the graph plugin, and explore the data, as the following figure shows:

Graph

Graph visualization in Kibana

In this graph, we can see a country, France, and all the related artists based on the music dataset.

We'll use graph in the related use case later in this book.

Reporting

Reporting is a new plugin brought in with the latest 2.x version to allow users to export the Kibana dashboard as a PDF. This is one of the most expected features from the Kibana users and is as simple as clicking on a button, as illustrated in the following screenshot:

Reporting

PDF generation in Kibana

The PDF generation is put into a queue; the users can follow the export process, and then download the PDF.

In the following chapter, we will get started with Kibana, going through the installation and a complete first use guide.

Summary

At this point, you should have a clear view of the different required components to build up a data-driven architecture. We have also seen how the Elastic stack fits this need, and that Kibana requires the other components of the stack in order to ship, transform, and store the visualized data.

In the next chapter, we'll see how to get started with Kibana and install all the components you need to see your first dashboard.

Left arrow icon Right arrow icon

Key benefits

  • Introduction to data-driven architecture and the Elastic stack
  • Build effective dashboards for data visualization and explore datasets with Elastic Graph
  • A comprehensive guide to learning scalable data visualization techniques in Kibana

Description

Kibana is an open source data visualization platform that allows you to interact with your data through stunning, powerful graphics. Its simple, browser-based interface enables you to quickly create and share dynamic dashboards that display changes to Elasticsearch queries in real time. In this book, you’ll learn how to use the Elastic stack on top of a data architecture to visualize data in real time. All data architectures have different requirements and expectations when it comes to visualizing the data, whether it’s logging analytics, metrics, business analytics, graph analytics, or scaling them as per your business requirements. This book will help you master Elastic visualization tools and adapt them to the requirements of your project. You will start by learning how to use the basic visualization features of Kibana 5. Then you will be shown how to implement a pure metric analytics architecture and visualize it using Timelion, a very recent and trendy feature of the Elastic stack. You will learn how to correlate data using the brand-new Graph visualization and build relationships between documents. Finally, you will be familiarized with the setup of a Kibana development environment so that you can build a custom Kibana plugin. By the end of this book you will have all the information needed to take your Elastic stack skills to a new level of data visualization.

Who is this book for?

If you are a developer, data visualization engineer, or data scientist who wants to get the best of data visualization at scale then this book is perfect for you. A basic understanding of Elasticsearch and Logstash is required to make the best use of this book.

What you will learn

  • How to create visualizations in Kibana
  • Ingest log data, structure an Elasticsearch cluster, and create visualization assets in Kibana
  • Embed Kibana visualization on web pages
  • Scaffold, develop, and deploy new Kibana & Timelion customizations
  • Build a metrics dashboard in Timelion based on time series data
  • Use the Graph plugin visualization feature and leverage a graph query
  • Create, implement, package, and deploy a new custom plugin
  • Use Prelert to solve anomaly detection challenges
Estimated delivery fee Deliver to Malta

Premium delivery 7 - 10 business days

€32.95
(Includes tracking information)

Product Details

Country selected
Publication date, Length, Edition, Language, ISBN-13
Publication date : Feb 15, 2017
Length: 284 pages
Edition : 1st
Language : English
ISBN-13 : 9781786463005
Vendor :
Elastic
Category :
Languages :

What do you get with Print?

Product feature icon Instant access to your digital eBook copy whilst your Print order is Shipped
Product feature icon Paperback book shipped to your preferred address
Product feature icon Download this book in EPUB and PDF formats
Product feature icon Access this title in our online reader with advanced features
Product feature icon DRM FREE - Read whenever, wherever and however you want
OR
Modal Close icon
Payment Processing...
tick Completed

Shipping Address

Billing Address

Shipping Methods
Estimated delivery fee Deliver to Malta

Premium delivery 7 - 10 business days

€32.95
(Includes tracking information)

Product Details

Publication date : Feb 15, 2017
Length: 284 pages
Edition : 1st
Language : English
ISBN-13 : 9781786463005
Vendor :
Elastic
Category :
Languages :

Packt Subscriptions

See our plans and pricing
Modal Close icon
€18.99 billed monthly
Feature tick icon Unlimited access to Packt's library of 7,000+ practical books and videos
Feature tick icon Constantly refreshed with 50+ new titles a month
Feature tick icon Exclusive Early access to books as they're written
Feature tick icon Solve problems while you work with advanced search and reference features
Feature tick icon Offline reading on the mobile app
Feature tick icon Simple pricing, no contract
€189.99 billed annually
Feature tick icon Unlimited access to Packt's library of 7,000+ practical books and videos
Feature tick icon Constantly refreshed with 50+ new titles a month
Feature tick icon Exclusive Early access to books as they're written
Feature tick icon Solve problems while you work with advanced search and reference features
Feature tick icon Offline reading on the mobile app
Feature tick icon Choose a DRM-free eBook or Video every month to keep
Feature tick icon PLUS own as many other DRM-free eBooks or Videos as you like for just €5 each
Feature tick icon Exclusive print discounts
€264.99 billed in 18 months
Feature tick icon Unlimited access to Packt's library of 7,000+ practical books and videos
Feature tick icon Constantly refreshed with 50+ new titles a month
Feature tick icon Exclusive Early access to books as they're written
Feature tick icon Solve problems while you work with advanced search and reference features
Feature tick icon Offline reading on the mobile app
Feature tick icon Choose a DRM-free eBook or Video every month to keep
Feature tick icon PLUS own as many other DRM-free eBooks or Videos as you like for just €5 each
Feature tick icon Exclusive print discounts

Frequently bought together


Stars icon
Total 124.97
Learning Kibana 5.0
€32.99
Mastering Elastic Stack
€45.99
Elasticsearch 5.x Cookbook
€45.99
Total 124.97 Stars icon
Banner background image

Table of Contents

9 Chapters
1. Introduction to Data-Driven Architecture Chevron down icon Chevron up icon
2. Installing and Setting Up Kibana 5.0 Chevron down icon Chevron up icon
3. Business Analytics with Kibana 5.0 Chevron down icon Chevron up icon
4. Logging Analytics with Kibana 5.0 Chevron down icon Chevron up icon
5. Metric Analytics with Metricbeat and Kibana 5.0 Chevron down icon Chevron up icon
6. Graph Exploration in Kibana Chevron down icon Chevron up icon
7. Customizing Kibana 5.0 Timelion Chevron down icon Chevron up icon
8. Anomaly Detection in Kibana 5.0 Chevron down icon Chevron up icon
9. Creating a Custom Plugin for Kibana 5.0 Chevron down icon Chevron up icon

Customer reviews

Rating distribution
Full star icon Full star icon Full star icon Half star icon Empty star icon 3.5
(2 Ratings)
5 star 0%
4 star 50%
3 star 50%
2 star 0%
1 star 0%
RK Apr 16, 2017
Full star icon Full star icon Full star icon Full star icon Empty star icon 4
This is a good book for those just getting started with kibana or want to fill in basic knowledge gaps. Would've liked more information on Timelion and any information on tile maps as the online information is rather slim on details. Worth the read!
Amazon Verified review Amazon
Rajeev Goel Sep 25, 2017
Full star icon Full star icon Full star icon Empty star icon Empty star icon 3
Not satsfied
Amazon Verified review Amazon
Get free access to Packt library with over 7500+ books and video courses for 7 days!
Start Free Trial

FAQs

What is the delivery time and cost of print book? Chevron down icon Chevron up icon

Shipping Details

USA:

'

Economy: Delivery to most addresses in the US within 10-15 business days

Premium: Trackable Delivery to most addresses in the US within 3-8 business days

UK:

Economy: Delivery to most addresses in the U.K. within 7-9 business days.
Shipments are not trackable

Premium: Trackable delivery to most addresses in the U.K. within 3-4 business days!
Add one extra business day for deliveries to Northern Ireland and Scottish Highlands and islands

EU:

Premium: Trackable delivery to most EU destinations within 4-9 business days.

Australia:

Economy: Can deliver to P. O. Boxes and private residences.
Trackable service with delivery to addresses in Australia only.
Delivery time ranges from 7-9 business days for VIC and 8-10 business days for Interstate metro
Delivery time is up to 15 business days for remote areas of WA, NT & QLD.

Premium: Delivery to addresses in Australia only
Trackable delivery to most P. O. Boxes and private residences in Australia within 4-5 days based on the distance to a destination following dispatch.

India:

Premium: Delivery to most Indian addresses within 5-6 business days

Rest of the World:

Premium: Countries in the American continent: Trackable delivery to most countries within 4-7 business days

Asia:

Premium: Delivery to most Asian addresses within 5-9 business days

Disclaimer:
All orders received before 5 PM U.K time would start printing from the next business day. So the estimated delivery times start from the next day as well. Orders received after 5 PM U.K time (in our internal systems) on a business day or anytime on the weekend will begin printing the second to next business day. For example, an order placed at 11 AM today will begin printing tomorrow, whereas an order placed at 9 PM tonight will begin printing the day after tomorrow.


Unfortunately, due to several restrictions, we are unable to ship to the following countries:

  1. Afghanistan
  2. American Samoa
  3. Belarus
  4. Brunei Darussalam
  5. Central African Republic
  6. The Democratic Republic of Congo
  7. Eritrea
  8. Guinea-bissau
  9. Iran
  10. Lebanon
  11. Libiya Arab Jamahriya
  12. Somalia
  13. Sudan
  14. Russian Federation
  15. Syrian Arab Republic
  16. Ukraine
  17. Venezuela
What is custom duty/charge? Chevron down icon Chevron up icon

Customs duty are charges levied on goods when they cross international borders. It is a tax that is imposed on imported goods. These duties are charged by special authorities and bodies created by local governments and are meant to protect local industries, economies, and businesses.

Do I have to pay customs charges for the print book order? Chevron down icon Chevron up icon

The orders shipped to the countries that are listed under EU27 will not bear custom charges. They are paid by Packt as part of the order.

List of EU27 countries: www.gov.uk/eu-eea:

A custom duty or localized taxes may be applicable on the shipment and would be charged by the recipient country outside of the EU27 which should be paid by the customer and these duties are not included in the shipping charges been charged on the order.

How do I know my custom duty charges? Chevron down icon Chevron up icon

The amount of duty payable varies greatly depending on the imported goods, the country of origin and several other factors like the total invoice amount or dimensions like weight, and other such criteria applicable in your country.

For example:

  • If you live in Mexico, and the declared value of your ordered items is over $ 50, for you to receive a package, you will have to pay additional import tax of 19% which will be $ 9.50 to the courier service.
  • Whereas if you live in Turkey, and the declared value of your ordered items is over € 22, for you to receive a package, you will have to pay additional import tax of 18% which will be € 3.96 to the courier service.
How can I cancel my order? Chevron down icon Chevron up icon

Cancellation Policy for Published Printed Books:

You can cancel any order within 1 hour of placing the order. Simply contact customercare@packt.com with your order details or payment transaction id. If your order has already started the shipment process, we will do our best to stop it. However, if it is already on the way to you then when you receive it, you can contact us at customercare@packt.com using the returns and refund process.

Please understand that Packt Publishing cannot provide refunds or cancel any order except for the cases described in our Return Policy (i.e. Packt Publishing agrees to replace your printed book because it arrives damaged or material defect in book), Packt Publishing will not accept returns.

What is your returns and refunds policy? Chevron down icon Chevron up icon

Return Policy:

We want you to be happy with your purchase from Packtpub.com. We will not hassle you with returning print books to us. If the print book you receive from us is incorrect, damaged, doesn't work or is unacceptably late, please contact Customer Relations Team on customercare@packt.com with the order number and issue details as explained below:

  1. If you ordered (eBook, Video or Print Book) incorrectly or accidentally, please contact Customer Relations Team on customercare@packt.com within one hour of placing the order and we will replace/refund you the item cost.
  2. Sadly, if your eBook or Video file is faulty or a fault occurs during the eBook or Video being made available to you, i.e. during download then you should contact Customer Relations Team within 14 days of purchase on customercare@packt.com who will be able to resolve this issue for you.
  3. You will have a choice of replacement or refund of the problem items.(damaged, defective or incorrect)
  4. Once Customer Care Team confirms that you will be refunded, you should receive the refund within 10 to 12 working days.
  5. If you are only requesting a refund of one book from a multiple order, then we will refund you the appropriate single item.
  6. Where the items were shipped under a free shipping offer, there will be no shipping costs to refund.

On the off chance your printed book arrives damaged, with book material defect, contact our Customer Relation Team on customercare@packt.com within 14 days of receipt of the book with appropriate evidence of damage and we will work with you to secure a replacement copy, if necessary. Please note that each printed book you order from us is individually made by Packt's professional book-printing partner which is on a print-on-demand basis.

What tax is charged? Chevron down icon Chevron up icon

Currently, no tax is charged on the purchase of any print book (subject to change based on the laws and regulations). A localized VAT fee is charged only to our European and UK customers on eBooks, Video and subscriptions that they buy. GST is charged to Indian customers for eBooks and video purchases.

What payment methods can I use? Chevron down icon Chevron up icon

You can pay with the following card types:

  1. Visa Debit
  2. Visa Credit
  3. MasterCard
  4. PayPal
What is the delivery time and cost of print books? Chevron down icon Chevron up icon

Shipping Details

USA:

'

Economy: Delivery to most addresses in the US within 10-15 business days

Premium: Trackable Delivery to most addresses in the US within 3-8 business days

UK:

Economy: Delivery to most addresses in the U.K. within 7-9 business days.
Shipments are not trackable

Premium: Trackable delivery to most addresses in the U.K. within 3-4 business days!
Add one extra business day for deliveries to Northern Ireland and Scottish Highlands and islands

EU:

Premium: Trackable delivery to most EU destinations within 4-9 business days.

Australia:

Economy: Can deliver to P. O. Boxes and private residences.
Trackable service with delivery to addresses in Australia only.
Delivery time ranges from 7-9 business days for VIC and 8-10 business days for Interstate metro
Delivery time is up to 15 business days for remote areas of WA, NT & QLD.

Premium: Delivery to addresses in Australia only
Trackable delivery to most P. O. Boxes and private residences in Australia within 4-5 days based on the distance to a destination following dispatch.

India:

Premium: Delivery to most Indian addresses within 5-6 business days

Rest of the World:

Premium: Countries in the American continent: Trackable delivery to most countries within 4-7 business days

Asia:

Premium: Delivery to most Asian addresses within 5-9 business days

Disclaimer:
All orders received before 5 PM U.K time would start printing from the next business day. So the estimated delivery times start from the next day as well. Orders received after 5 PM U.K time (in our internal systems) on a business day or anytime on the weekend will begin printing the second to next business day. For example, an order placed at 11 AM today will begin printing tomorrow, whereas an order placed at 9 PM tonight will begin printing the day after tomorrow.


Unfortunately, due to several restrictions, we are unable to ship to the following countries:

  1. Afghanistan
  2. American Samoa
  3. Belarus
  4. Brunei Darussalam
  5. Central African Republic
  6. The Democratic Republic of Congo
  7. Eritrea
  8. Guinea-bissau
  9. Iran
  10. Lebanon
  11. Libiya Arab Jamahriya
  12. Somalia
  13. Sudan
  14. Russian Federation
  15. Syrian Arab Republic
  16. Ukraine
  17. Venezuela