Generating a line graph using Python
We will use a basic plot() to show how graphics work in Python to generate a line graph. Then, we will use several other libraries for other interesting visualizations available from Python.
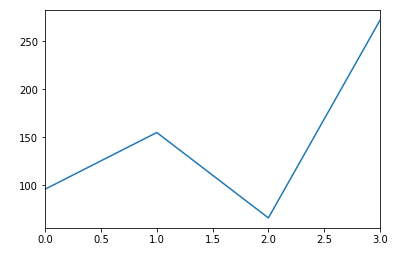
For this example, we are using made-up data to determine the number of births that have the same name and producing a line plot of the data.
How to do it...
We can use this Python script:
import pandas
import matplotlib
%matplotlib inline

baby_name = ['Alice','Charles','Diane','Edward']
number_births = [96, 155, 66, 272]
dataset = list(zip(baby_name,number_births))
df = pandas.DataFrame(data = dataset, columns=['Name', 'Number'])
df['Number'].plot()
With the resulting plot as:

This is fictitious data, but it does show a good, clean graphic.
How it works...
pandas is the built-in Python library for dealing with a dataset. matplotlib is the Python library that will plot our data. We use the command %matplotlib inline to have the plot show up in our notebook. Otherwise, Python...


