The Java toolset that comes with the JDK supports the execution and management of running Java applications as well. To have some program that we can manage while executing, we will need a code that runs not only for a few milliseconds but, while it runs, it also prints something to the console. Let's create a new program called HelloWorldLoop.java with the following content:
public class HelloWorldLoop {
  public static void main(String[] args){
       for( ;; ){
         System.out.println("Hello World");
         }
       }
  }
The program contains a for loop. Loops allow repeated execution of a code block, and we will discuss them in Chapter 2, The First Real Java Program - Sorting Names. The loop we created here is a special one that never terminates but repeats the printing method call, printing Hello World until we kill the program by pressing Ctrl + c or issuing a kill command on Linux or on OSX, or terminate the program in the task manager under Windows.
Compile and start it in one window and open another Terminal window to manage the application.
The first command that we should get familiar with is jps. http://docs.oracle.com/javase/7/docs/technotes/tools/share/jps.html It lists the Java processes that run on the machine, which are as follows:
$ jps
21873 sun.tools.jps.Jps
21871 HelloWorldLoop
You can see that there are two processes—one is the program we execute and the other is the jps program itself. Not surprisingly, the jps tool is also written in Java. You can also pass options to jps, which are documented on the web.
There are many other tools and we will examine one of them, which is a very powerful and easy-to-use tool—Java VisualVM.
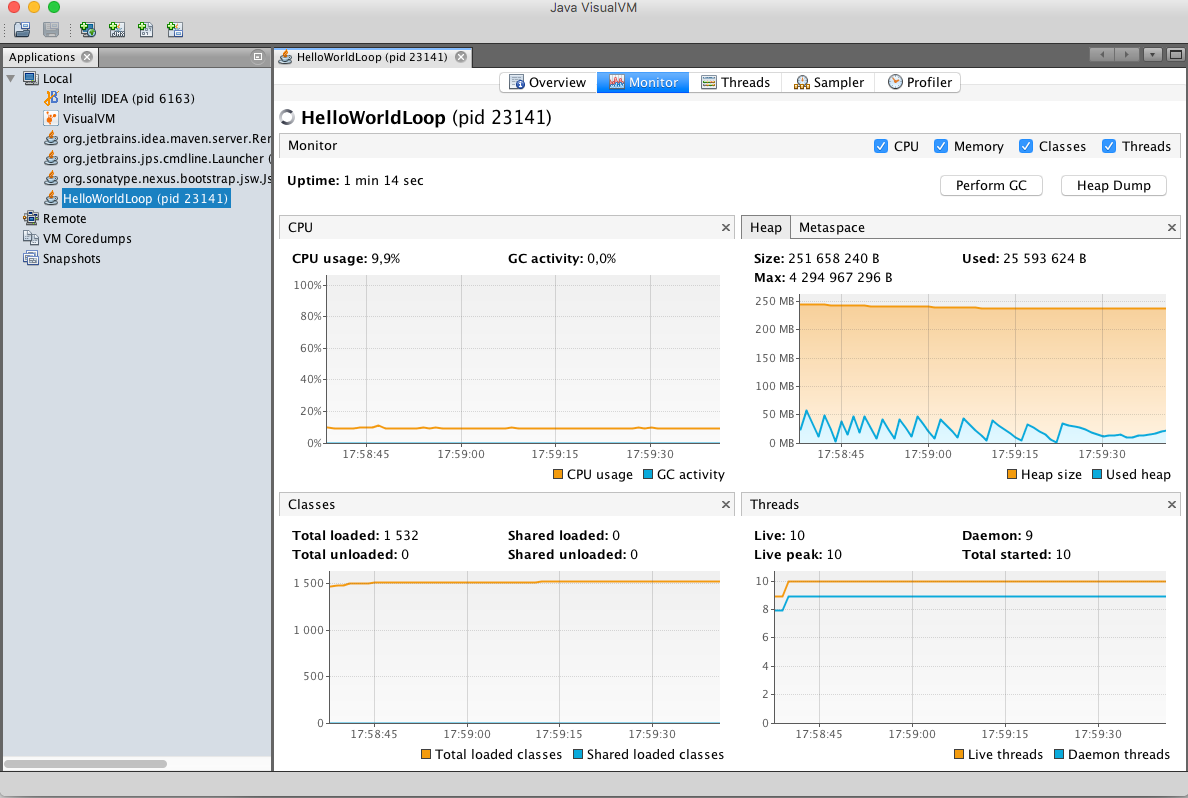
VisualVM is a command-line graphical tool that connects to the running Java process and displays the different performance parameters. To start the VisualVM tool, you will issue the jvisualvm command without any parameters. Soon, a window will appear with an exploring tree on the left-hand side and a welcome pane on the right. The left side shows all the running Java processes under the branch named Local. If you double click on HelloWorldLoop, it will open the details of the process on the right pane. On the header tabs, you can select Overview, Monitor, Threads, Sampler, and Profiler. The first three tabs are the most important and give you a good view of what is happening in JVM regarding the number of threads, CPU usage, memory consumption, and so on.


