Search icon CANCEL
Subscription
0
Cart icon
Your Cart (0 item)
Close icon
You have no products in your basket yet
Arrow left icon
Explore Products
Best Sellers
New Releases
Books
Videos
Audiobooks
Learning Hub
Conferences
Free Learning
Arrow right icon
Arrow up icon
GO TO TOP
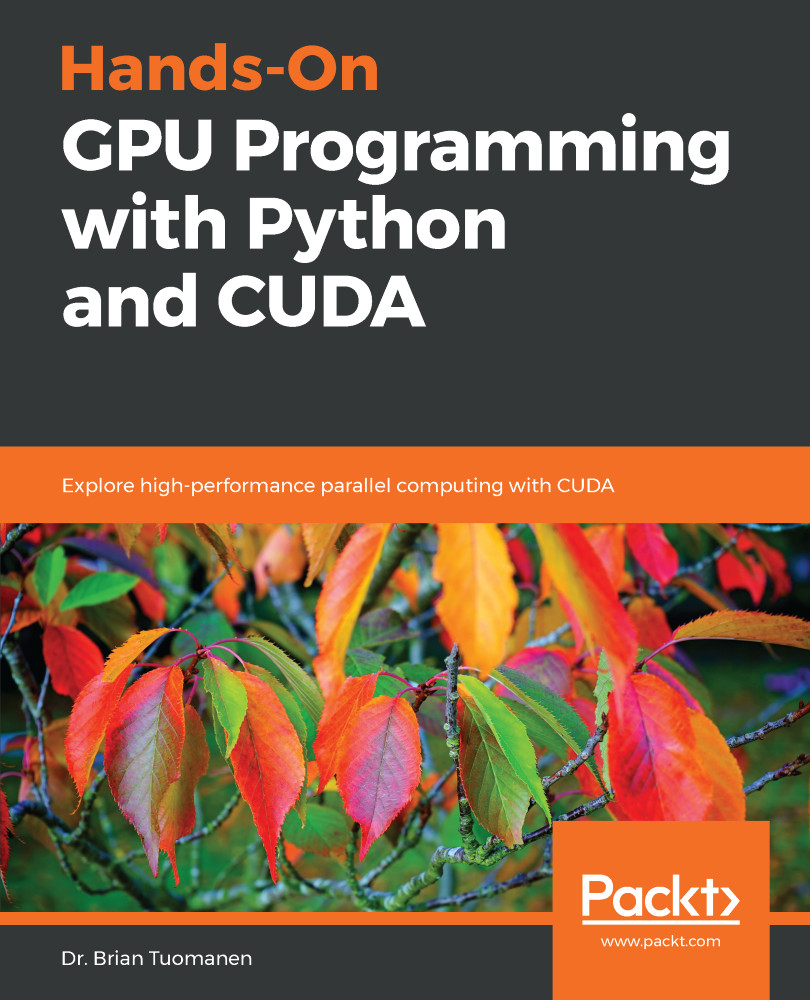
Hands-On GPU Programming with Python and CUDA

You're reading from   Hands-On GPU Programming with Python and CUDA Explore high-performance parallel computing with CUDA

Arrow left icon
Product type Paperback
Published in Nov 2018
Publisher Packt
ISBN-13 9781788993913
Length 310 pages
Edition 1st Edition
Languages
Tools
Arrow right icon
Author (1):
Arrow left icon
Dr. Brian Tuomanen Dr. Brian Tuomanen
Author Profile Icon Dr. Brian Tuomanen
Dr. Brian Tuomanen
Arrow right icon
View More author details
Toc

Table of Contents (15) Chapters Close

Preface 1. Why GPU Programming? FREE CHAPTER 2. Setting Up Your GPU Programming Environment 3. Getting Started with PyCUDA 4. Kernels, Threads, Blocks, and Grids 5. Streams, Events, Contexts, and Concurrency 6. Debugging and Profiling Your CUDA Code 7. Using the CUDA Libraries with Scikit-CUDA 8. The CUDA Device Function Libraries and Thrust 9. Implementation of a Deep Neural Network 10. Working with Compiled GPU Code 11. Performance Optimization in CUDA 12. Where to Go from Here 13. Assessment 14. Other Books You May Enjoy

Using the NVIDIA nvprof profiler and Visual Profiler

We will end with a brief overview of the command-line Nvidia nvprof profiler. In contrast to the Nsight IDE, we can freely use any Python code that we have written—we won't be compelled here to write full-on, pure CUDA-C test function code.

We can do a basic profiling of a binary executable program with the nvprof program command; we can likewise profile a Python script by using the python command as the first argument, and the script as the second as follows: nvprof python program.py. Let's profile the simple matrix-multiplication CUDA-C executable program that we wrote earlier, with nvprof matrix_ker:

We see that this is very similar to the output of the Python cProfiler module that we first used to analyze a Mandelbrot algorithm way back in Chapter 1, Why GPU Programming?—only now, this exclusively...

lock icon The rest of the chapter is locked
Register for a free Packt account to unlock a world of extra content!
A free Packt account unlocks extra newsletters, articles, discounted offers, and much more. Start advancing your knowledge today.
Unlock this book and the full library FREE for 7 days
Get unlimited access to 7000+ expert-authored eBooks and videos courses covering every tech area you can think of
Renews at $19.99/month. Cancel anytime
Banner background image