


Creating Hierarchies and Groups
Hierarchies and groups are semantic model structures that can be implemented to simplify the user and report authoring experience. Hierarchies provide single-click access to multiple columns of a table, enabling users to navigate through pre-defined levels, such as the weeks within a given month. Groups comprise individual values of a column that enable analysis and visualization of the combined total as though it is a single value. Hierarchies and groups have useful applications in almost all semantic models, and it is important to understand the relationship of these structures to the semantic model and visualizations.
This recipe provides an example of utilizing DAX parent/child hierarchy functions to create columns of a hierarchy. The hierarchy is then implemented into the semantic model, and a group is created to further benefit the analysis.
Getting ready
To prepare for this recipe, follow these steps:
- Open Power BI Desktop.
- Create an
Importmode data source query calledAdventureWorksDW2022. See the Getting ready section of the Implementing a Semantic Model recipe in this chapter for reference. - Isolate this query in a query group called
Data Sourcesand disable loading. - Right-click
AdventureWorksDW2022and choose Reference. - Select the
FactInternetSalestable and name this queryInternet Sales. - Repeat steps 4 and 5 to create a
General Ledgerquery that importsFactFinance. - Create a
Productsquery based on theDimProduct,DimProductCategory, andDimProductSubcategorytables. See step 7 in the Getting ready section of the Creating Relationships recipe in this chapter for reference. - Create an
Accountsquery using the following code:let Source = AdventureWorksDW2022, dbo_DimCustomer = Source{[Schema="dbo",Item="DimAccount"]}[Data], Parent = Table.ExpandRecordColumn( dbo_DimCustomer, "DimAccount(ParentAccountKey)", {"AccountDescription"}, {"ParentAccountDescription"}) in Parent - Move the
Internet SalesandGeneral Ledgerqueries to a query group calledFacts, and theProductsandAccountsqueries to a query group calledDimensions. - Click Close & Apply in the ribbon of the Home tab to load the tables to the semantic model.
- Create the Single cross-filtering relationships shown in Figure 3.27.
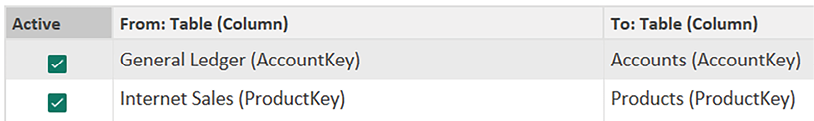
Figure 3.27: Model relationships
How to create hierarchies and groups
To implement this recipe, use the following steps:
- In the Table view, create the following seven calculated columns in the
Accountstable:Path = PATH('Accounts'[AccountKey],'Accounts'[ParentAccountKey]) Account Level 1 = VAR __Key = PATHITEM('Accounts'[Path],1,1) VAR __Result = LOOKUPVALUE('Accounts'[AccountDescription],'Accounts'[AccountKey], __Key) RETURN __Result Account Level 2 = VAR __Key = PATHITEM('Accounts'[Path],2,1) VAR __Result = LOOKUPVALUE('Accounts'[AccountDescription],'Accounts'[AccountKey], __Key) RETURN __Result Account Level 3 = VAR __Key = PATHITEM('Accounts'[Path],3,1) VAR __Result = LOOKUPVALUE('Accounts'[AccountDescription],'Accounts'[AccountKey], __Key) RETURN __Result Account Level 4 = VAR __Key = PATHITEM('Accounts'[Path],4,1) VAR __Result = LOOKUPVALUE('Accounts'[AccountDescription],'Accounts'[AccountKey], __Key) RETURN __Result Account Level 5 = VAR __Key = PATHITEM('Accounts'[Path],5,1) VAR __Result = LOOKUPVALUE('Accounts'[AccountDescription],'Accounts'[AccountKey], __Key) RETURN __Result Account Level 6 = VAR __Key = PATHITEM('Accounts'[Path],6,1) VAR __Result = LOOKUPVALUE('Accounts'[AccountDescription],'Accounts'[AccountKey], __Key) RETURN __Result - In the Data pane of the Table view, right-click the
Account Level 1column and choose Create hierarchy. - Rename the
Account Level 1 HierarchytoAccount Hierarchyby right-clicking the hierarchy and choosing Rename. - Right-click the
Account Level 2column, choose Add to hierarchy, and then Account Hierarchy. - Repeat step 4 for the Account Level 3, Account Level 4, Account Level 5, and Account Level 6 columns in order.
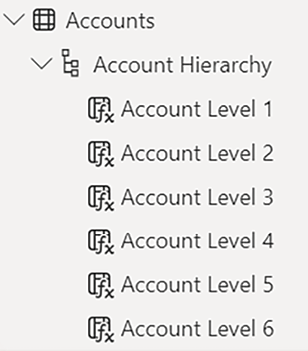
Figure 3.28: Hierarchy in the Data pane
- Right-click the individual columns that comprise the hierarchy and choose Hide in report view.
- Switch to the Report view and create a Matrix visualization with Account Hierarchy as Rows and the
Amountcolumn from theGeneral Ledgertable as Values.
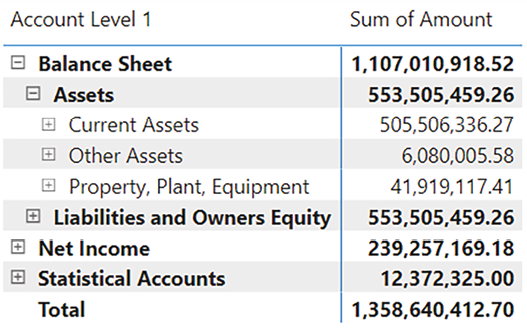
Figure 3.29: Matrix visual of Account Hierarchy
- In the Data pane, right-click the
Product Subcategorycolumn in theProductstable and choose New group. - Rename the group
Product Subcategoriesby editing the Name field. - Hold down the Ctrl key and then in the Ungrouped values area select
Caps,Gloves,Helmets,Jerseys,Socks,Tights, andVests. - Press the Group button.
- Double-click the Caps & Gloves & Helmets… group in the Groups and members area and rename the group
Bike Attire Accessories. - Check the box for Include Other group and click the OK button.
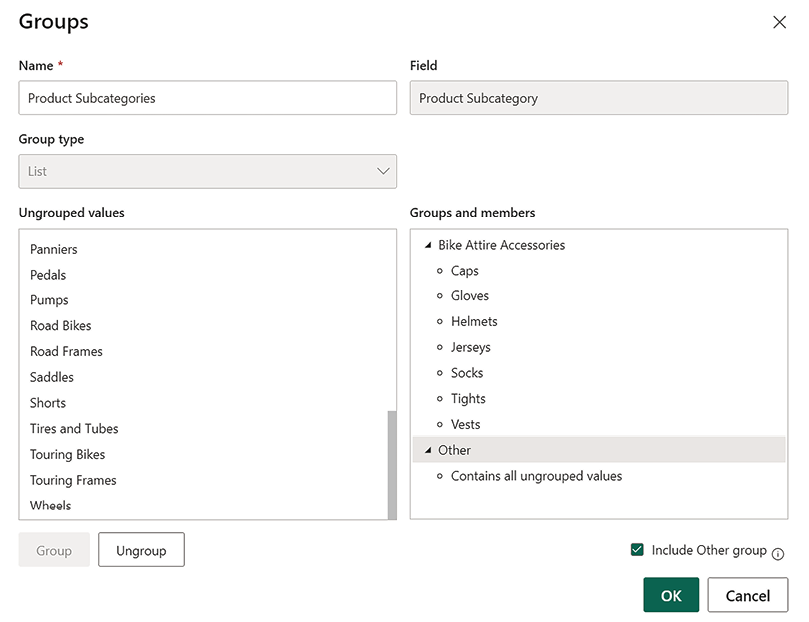
Figure 3.30: Groups dialog
- Create a Clustered bar chart visualization with the Product Subcategories group in the
Productstable as theAxis, and theSalesAmountcolumn from theInternet Salestable as theValues.
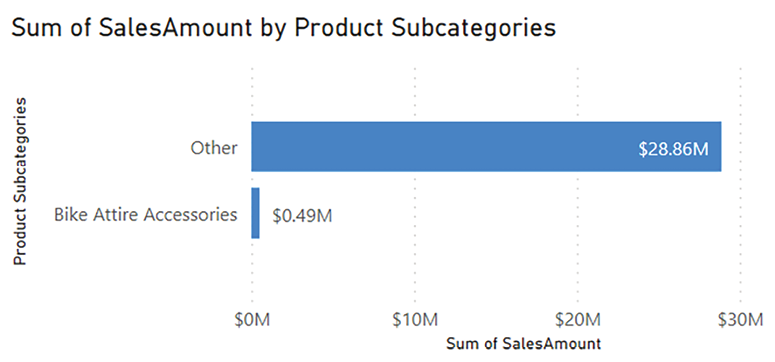
Figure 3.31: Product Subcategories group with the Other group enabled
How it works
For the hierarchy created, the PATH function compares a child key column with the parent key column and returns a delimited text string containing all the parent members for the given row.
For the Account Level columns, the PATHITEM function returns the key value from a path from highest to lowest based on the position parameter. The third and final parameter of the PATHITEM function (1) specifies to return this value as an integer. Also, note that the variable name of Key is prefixed by two underscore characters. This is because Key is a reserved word in DAX. It is a good habit to prefix variable names in DAX with one or more characters like underscores in order to avoid conflicts with reserved words as well as help quickly identify variables.
The LOOKUPVALUE function compares the account key with the key returned by the PATHITEM function and returns the column specified by the first parameter, AccountDescription. Some rows have blank values for a given column because it is higher in the structure; for example, the Balance Sheet account does not have values for the columns of level 2 through 6. The calculated columns appear in the Data pane with formula icons.
The hierarchy can now be added to visuals with a single click. Drilldown is available to navigate all six columns. Alternatively, in Matrix visualizations, the expand and collapse controls at the beginning of each row can be used to investigate the hierarchy. With the hierarchy in the Data pane, usability may be improved by hiding the individual columns. However, individual columns may be needed to view a different order of the columns or to view the individual columns of the hierarchy on opposing axes.
Consider the hierarchy created in this recipe as a natural hierarchy versus an unnatural hierarchy. A natural hierarchy contains unique child values for each parent value and is the recommended structure of hierarchies. For example, each unique value in a Fiscal Year column would have 12 unique child values, such as 2017-Mar. An unnatural hierarchy would have the same child value repeated across multiple parent values.
In almost all scenarios, the SQL source views or M queries are preferable alternatives to DAX-calculated columns. The DAX parent-child functions used were developed for this type of scenario but are best used with small tables and models. For example, the Accounts table only has 99 rows. Calculated columns and tables in DAX use the resources of the model during processing/refresh operations and can produce a lower compression rate, thus increasing the memory footprint of the model. Thus, you should generally avoid calculated columns on large fact tables except in certain self-service visualization situations.
Grouping can make Power BI reports and dashboards more intuitive and help simplify analyses. Often, grouping is used with less common dimension values that might clutter data visualizations. If a particular grouping created in Power BI Desktop becomes pervasive throughout reports and dashboards, it may be appropriate to build the equivalent into the data warehouse or the retrieval queries of the semantic model. The name for the new group, Product Subcategories, is exposed in the Data pane with a unique shape icon. In addition, the name for the new groups is also exposed in the Table view as a column.
By default, the Include Other group option in the Groups dialog box is not enabled. If enabled, all other distinct values or members of the column not included in a group are grouped into the Other group. In the Table view, members of the Other group are displayed as having the value (Blank).
There’s more…
Grouping is also available for date and numerical data type columns and includes the concept of “binning,” or grouping based upon values falling into particular ranges. For example, the ListPrice column from the Products table can be divided into equally sized bins for analysis across the ranges of prices. The specific size of a bin or a set number of bins can be selected. A similar dialog is available for date data types.
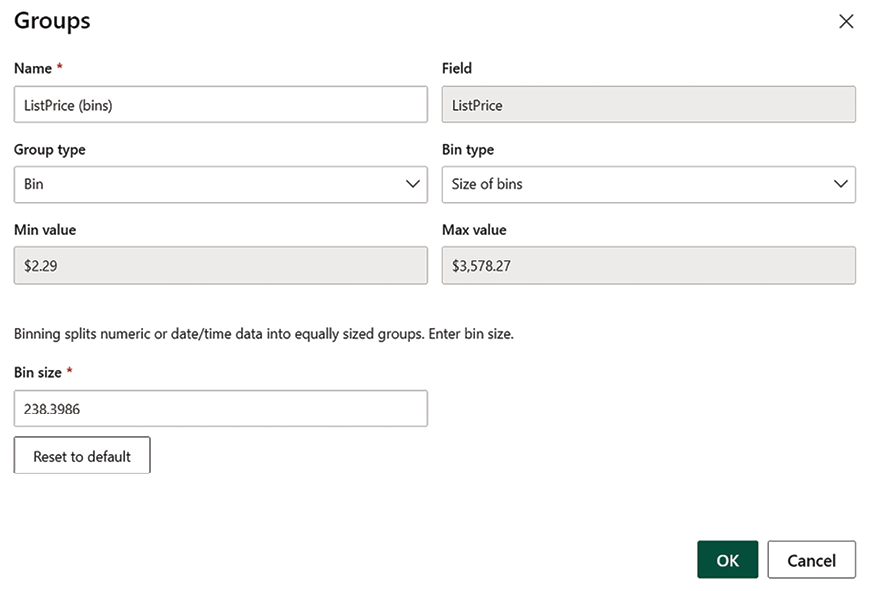
Figure 3.32: Grouping bins for a numeric data type column
See also
- DAX function reference: http://bit.ly/3rrQFlt
- Use grouping and binning in Power BI Desktop: http://bit.ly/2pALaBc


