Search icon CANCEL
Subscription
0
Cart icon
Cart
Close icon
You have no products in your basket yet
Save more on your purchases!
Savings automatically calculated. No voucher code required
Arrow left icon
All Products
Best Sellers
New Releases
Books
Videos
Audiobooks
Learning Hub
Newsletters
Free Learning
Arrow right icon
Arrow up icon
GO TO TOP
Stream Analytics with Microsoft Azure

You're reading from  Stream Analytics with Microsoft Azure

Product type Book
Published in Dec 2017
Publisher Packt
ISBN-13 9781788395908
Pages 322 pages
Edition 1st Edition
Languages
Authors (2):
Ryan Murphy Ryan Murphy
Profile icon Ryan Murphy
Manpreet Singh Manpreet Singh
Profile icon Manpreet Singh
View More author details
Toc

Table of Contents (18) Chapters close

Title Page
Credits
About the Authors
About the Reviewers
www.PacktPub.com
Customer Feedback
Preface
1. Introducing Stream Processing and Real-Time Insights 2. Introducing Azure Stream Analytics and Key Advantages 3. Designing Real-Time Streaming Pipelines 4. Developing Real-Time Event Processing with Azure Streaming 5. Building Using Stream Analytics Query Language 6. How to achieve Seamless Scalability with Automation 7. Integration of Microsoft Business Intelligence and Big Data 8. Designing and Managing Stream Analytics Jobs 9. Optimizing Intelligence in Azure Streaming 10. Understanding Stream Analytics Job Monitoring 11. Use Cases for Real-World Data Streaming Architectures

Configuring SU using Azure portal


We will now look into how to scale the SUs for a Stream Analytics job using the Azure portal step by step:

  1. Open the job that was previously created in the Azure portal. In the job blade, click the Scale option in the CONFIGURE section:
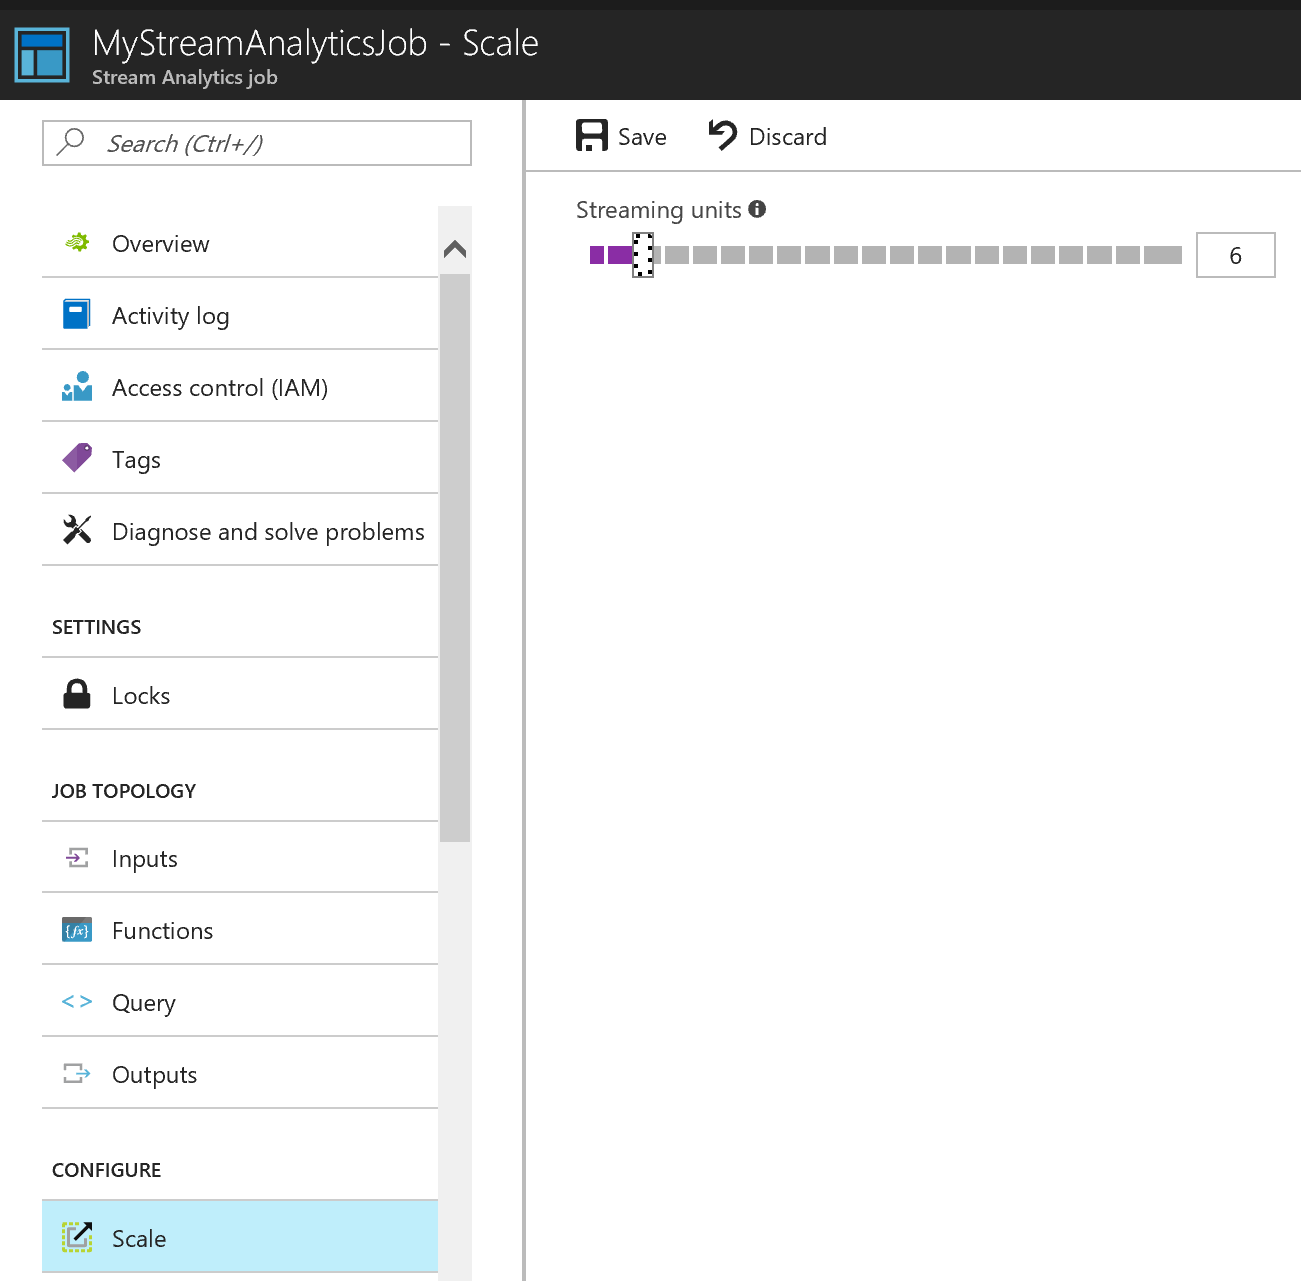
  1. Drag the SUs slide to the desired number of units, then click the Save button.
  2. To monitor how many SUs a job is using, open the job in the Azure portal.
  3. In the job blade, click the Metrics option in the Monitoring section.
  4. Under Available metrics, select SU % Utilization. You can provide a title and subtitle for the metrics chart, change the Chart type and Time range, and pin the chart to your dashboard. You can also add an alert on the metric as well, so you can receive a notification if the metric exceeds a particular threshold, as follows:

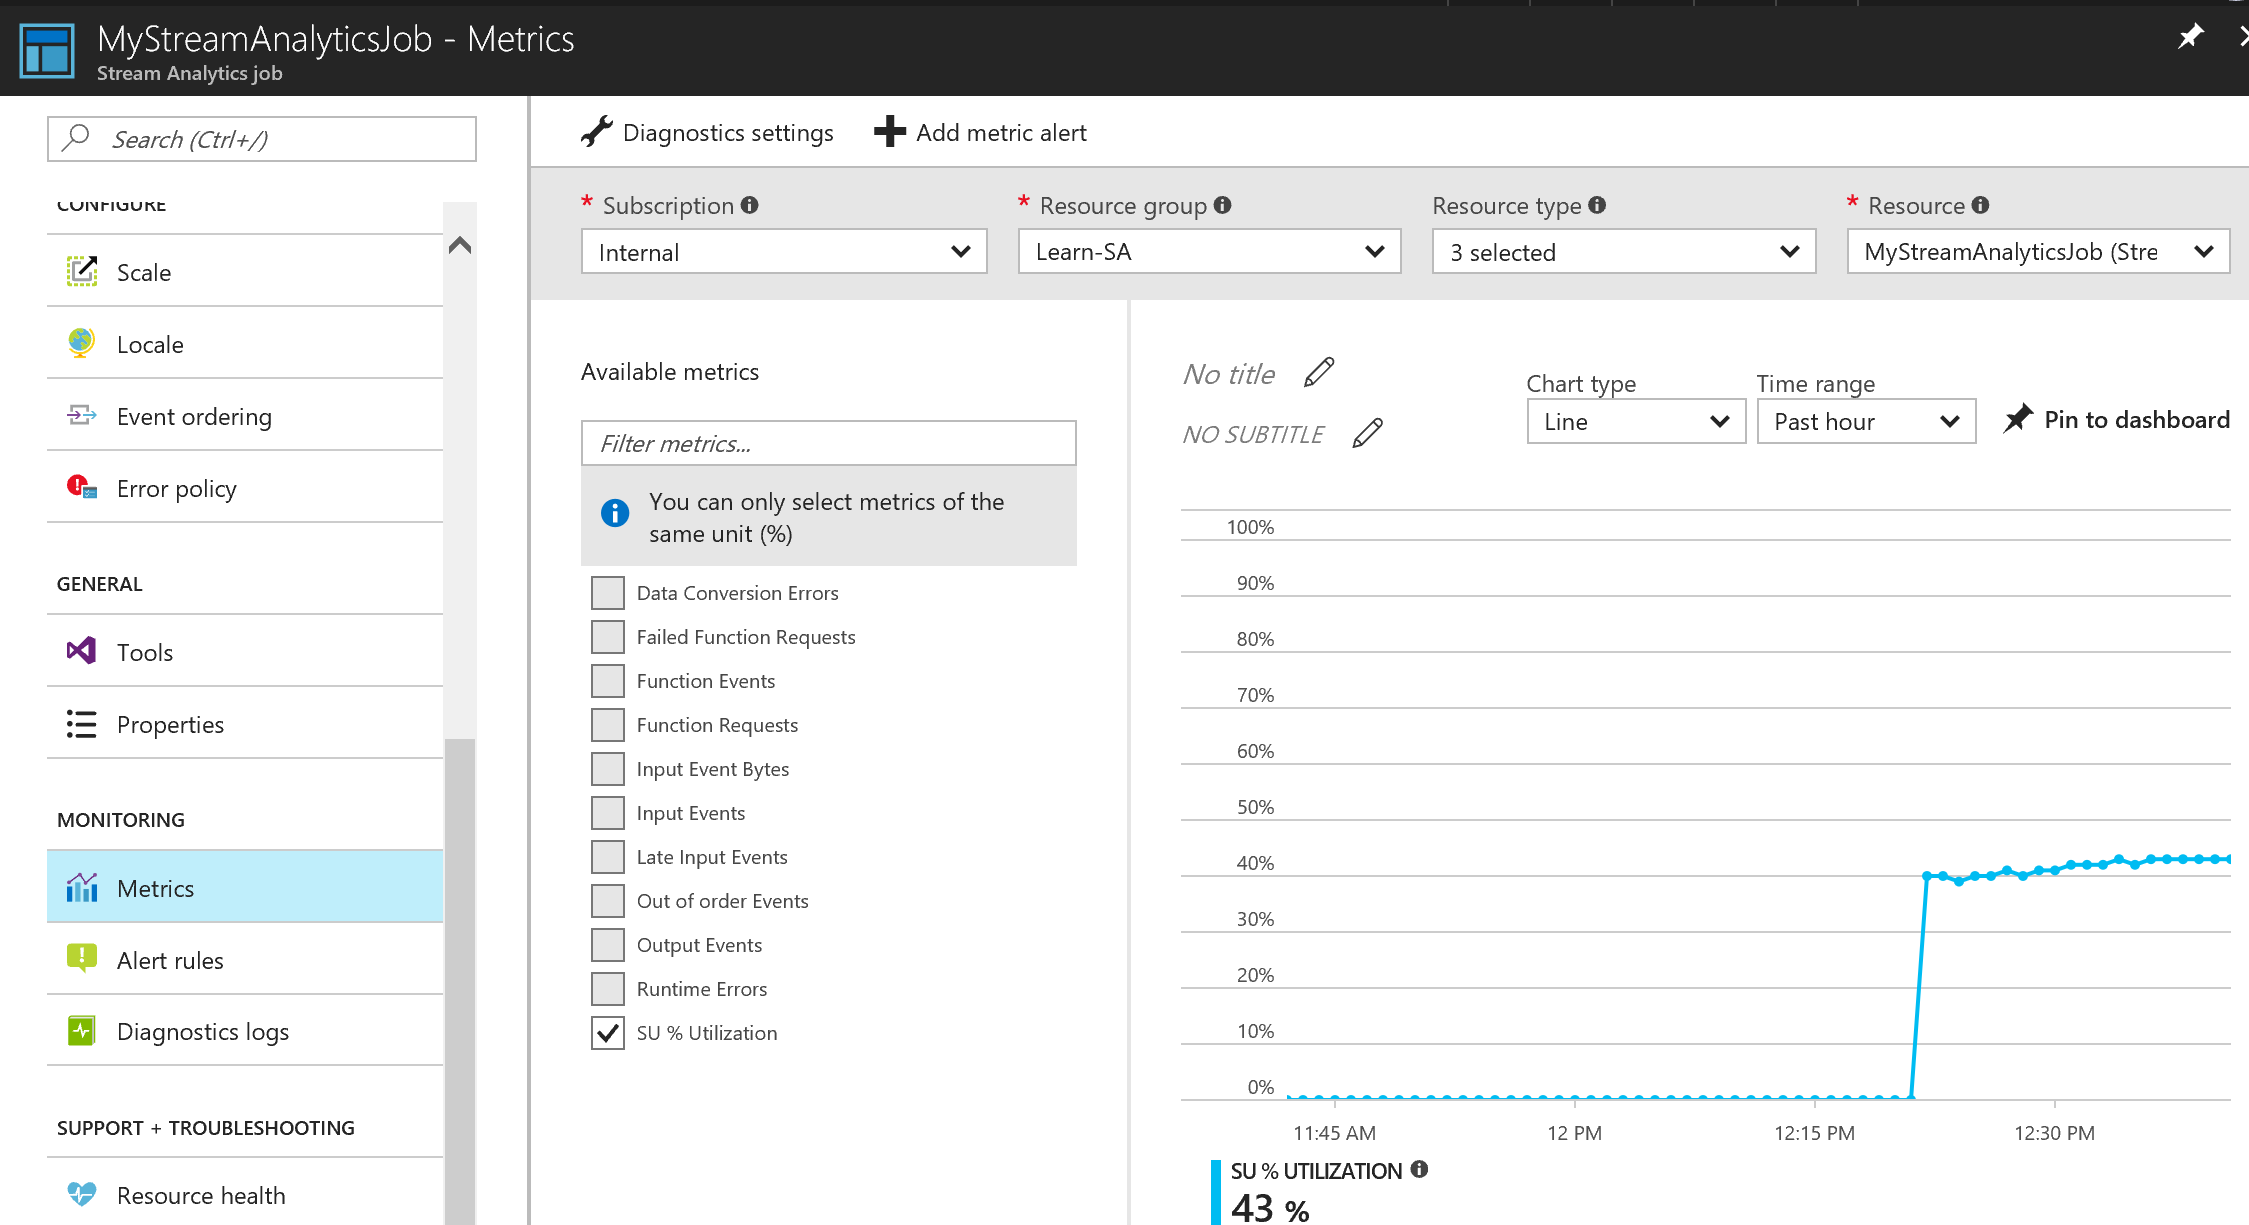
Generally, the SU % Utilization number should be at 80% or lower so that there is enough capacity to handle spikes.

  1. You can also look at the number of Input Events and Output Events to measure...
lock icon The rest of the chapter is locked
Register for a free Packt account to unlock a world of extra content!
A free Packt account unlocks extra newsletters, articles, discounted offers, and much more. Start advancing your knowledge today.
Unlock this book and the full library FREE for 7 days
Get unlimited access to 7000+ expert-authored eBooks and videos courses covering every tech area you can think of
Renews at €14.99/month. Cancel anytime