


Connecting to your data warehouse
Your data warehouse with Redshift Serverless is now ready. You can connect to your data warehouse using third-party tools via JDBC/ODBC/Python drivers. Other options include the Data API or the embedded Redshift query editor v2.
Using Amazon Redshift query editor v2
Now that your data warehouse is ready; let’s navigate to the query editor to load some sample data and run some queries. Select the Query data option from your dashboard, as shown in Figure 1.13, and you will be navigated to the query editor, as shown in Figure 1.14.
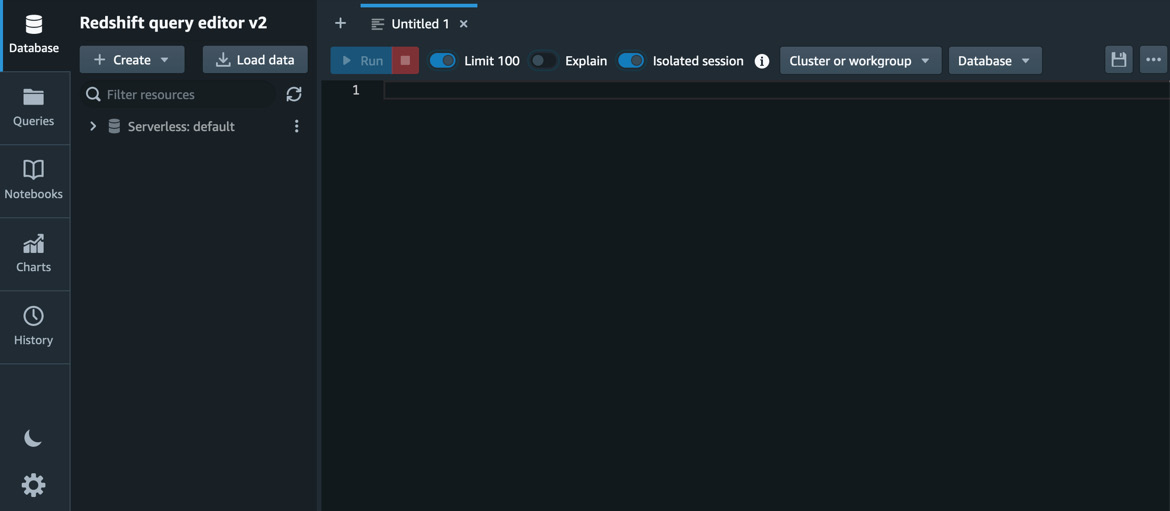
Figure 1.14 – Query editor
In the Redshift query editor v2 console, on the left pane, you will see the data warehouses, such as the Serverless:default workgroup, that you have access to. Click on the workgroup (Serverless:default) to connect to the data warehouse.
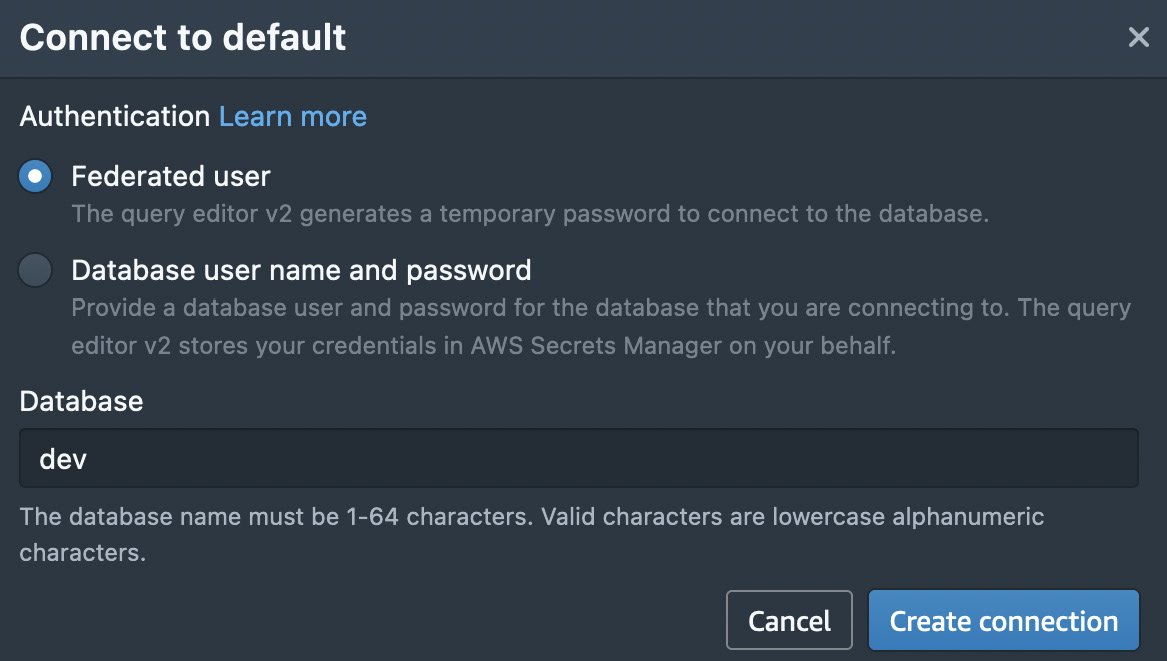
Figure 1.15 – Creating a connection to your workgroup
As shown in the preceding screenshot, select Federated user if you did not specify any database credentials while creating the namespace, and then click Create connection. You can leave the database name as dev. You will be prompted to create a connection only when connecting to the data warehouse for the first time. If you have created the connection, you will be connected automatically when you click on the workgroup. Once you are connected, you will see the databases in the navigator, as shown in Figure 1.16:
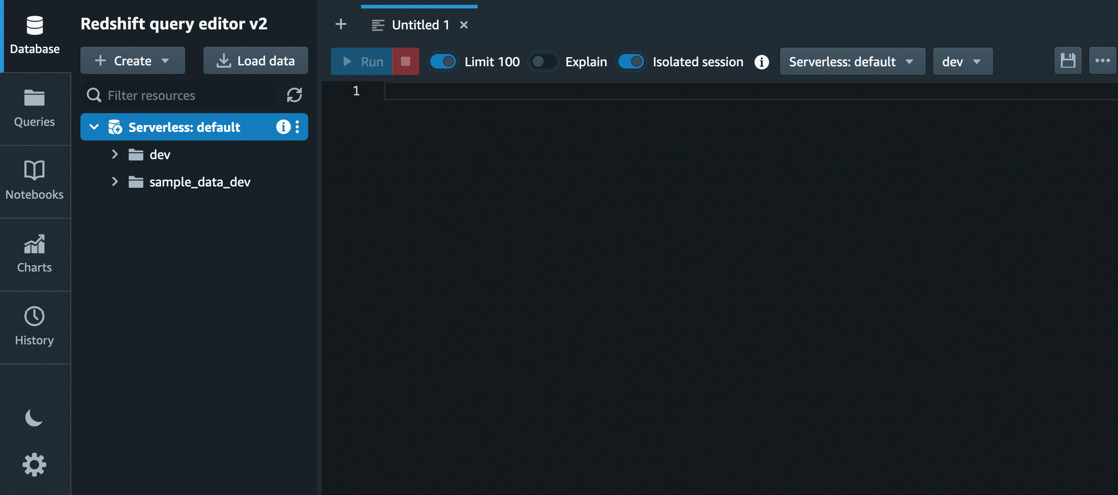
Figure 1.16 – List of databases
Since we just created our data warehouse for the first time, there is no data present in it, so let’s load some sample data into the data warehouse now.
Loading sample data
On the left pane, click on the sample_data_dev database to expand the available database:
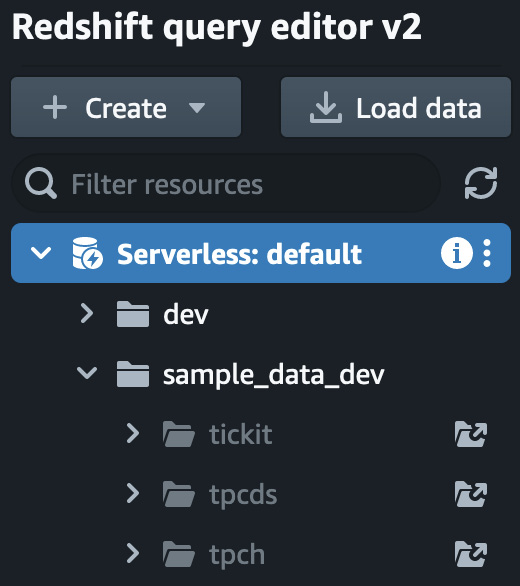
Figure 1.17 – The Redshift query editor v2 navigator that shows the sample data available
As you can see from the preceding screenshot, three sample datasets are available for you to load into your data warehouse. Click on the icon showing the folder with an arrow located to the right of your chosen sample data notebook to load and open it, as shown in Figure 1.18:
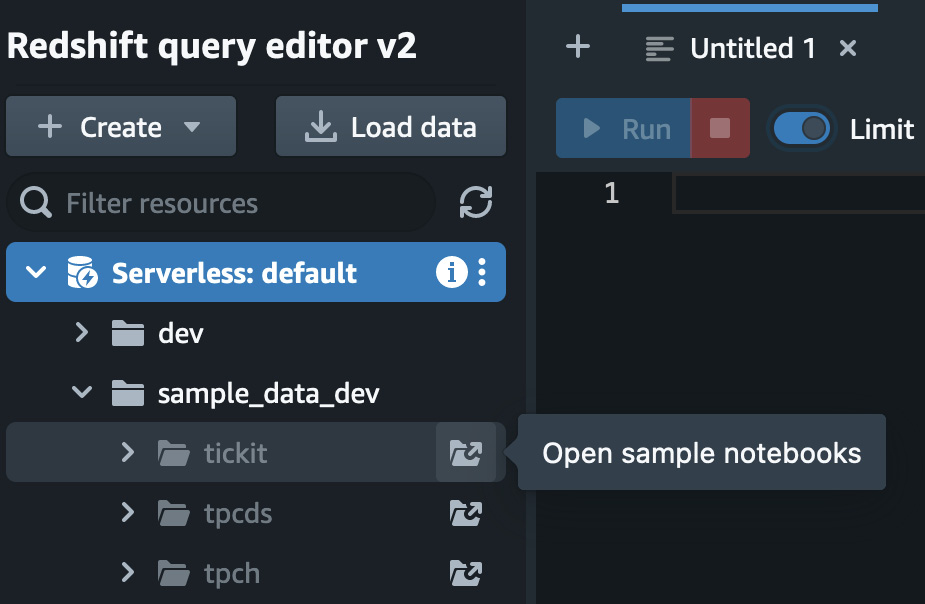
Figure 1.18 – List of sample databases
You will be prompted to create your sample database. Click on Create to get started, as shown in Figure 1.19:
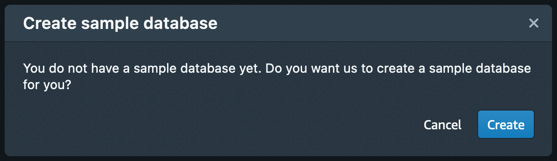
Figure 1.19 – Creating a sample database
The sample data will be loaded in a few seconds and presented in a notebook with SQL queries for the dataset that you can explore, as shown in Figure 1.20:
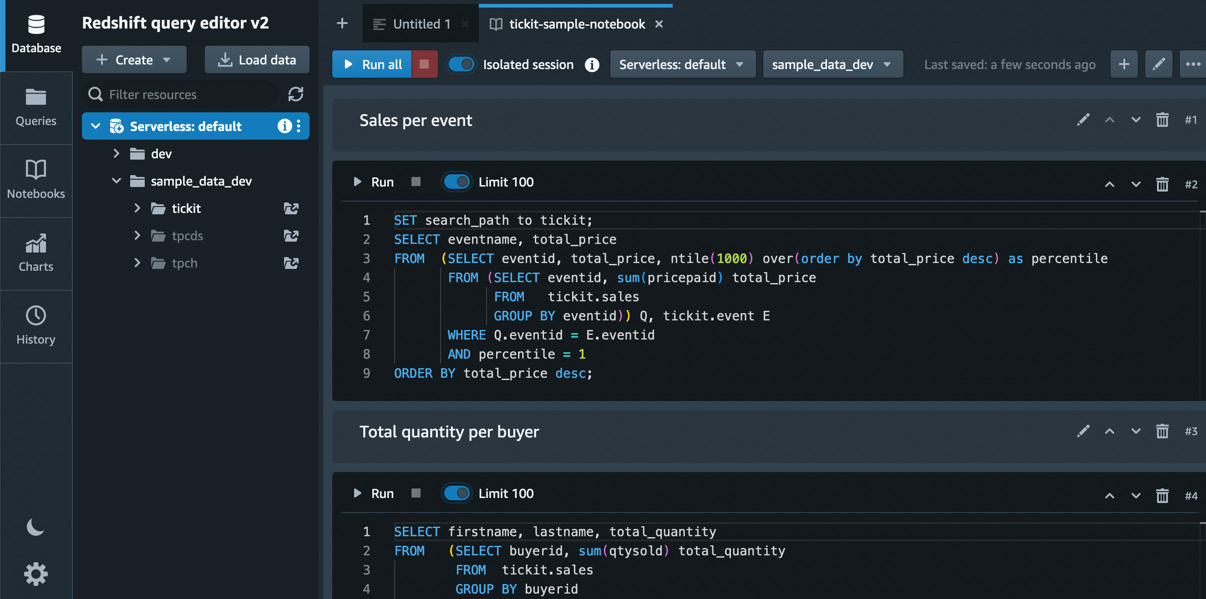
Figure 1.20 – Notebook with sample queries for the tickit database
You can expand the navigation tree on the left side of the query editor to view schemas and database objects, such as tables and views in your schema, as shown in Figure 1.21.
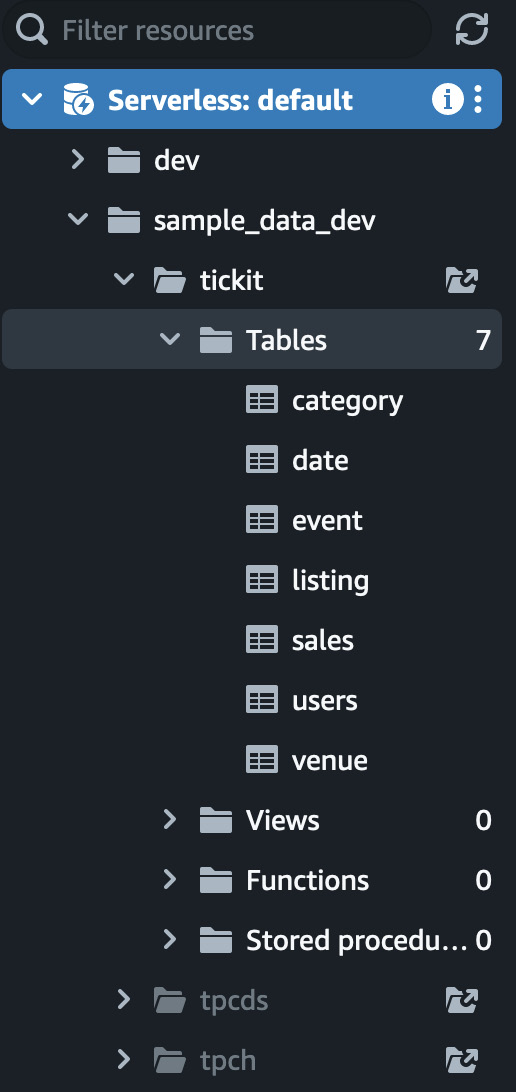
Figure 1.21 – Expanding the navigation tree to view schemas and database objects
You can click on a table to view the table definitions, as shown in Figure 1.22:
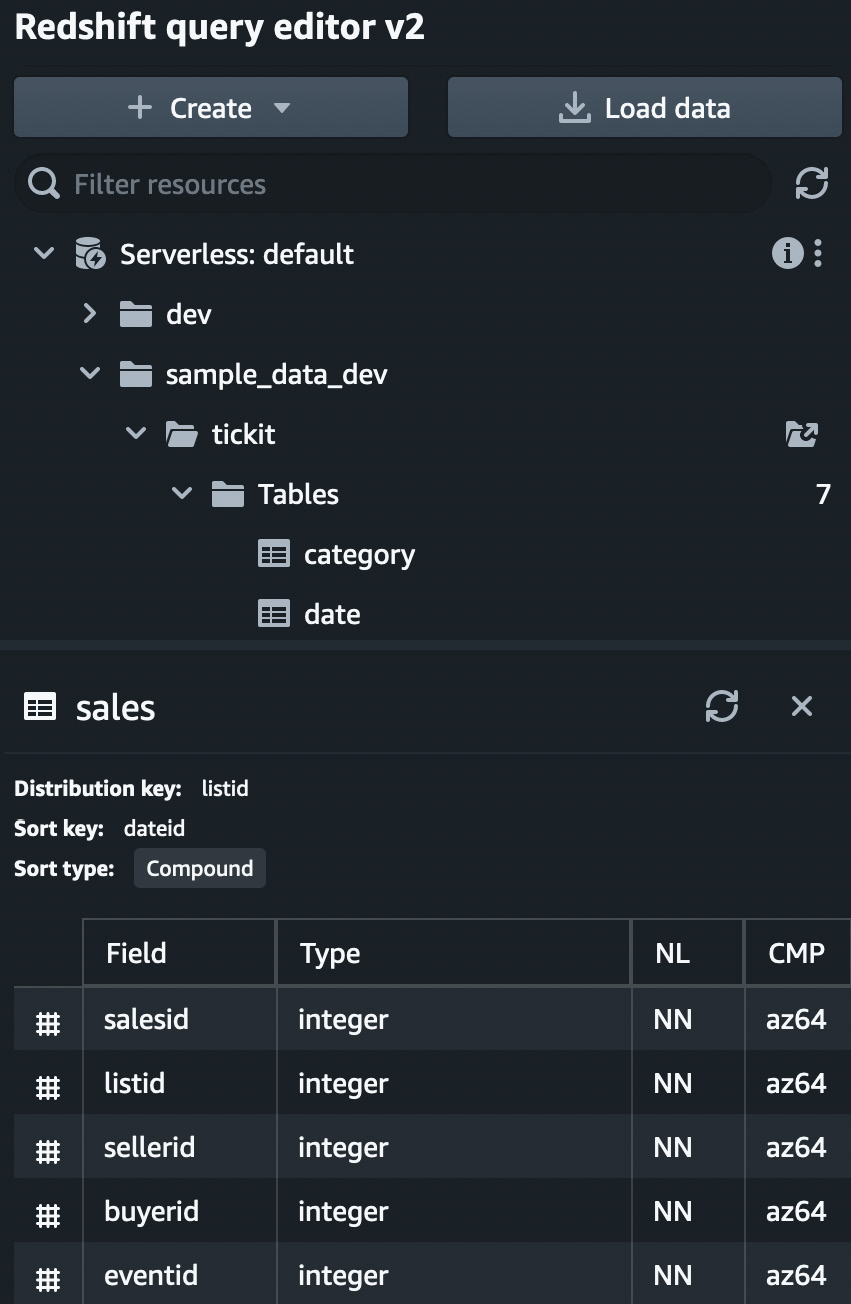
Figure 1.22 – Table definitions
Right-clicking on a table provides additional Select table, Show table definition, and Delete options, as shown in Figure 1.23:
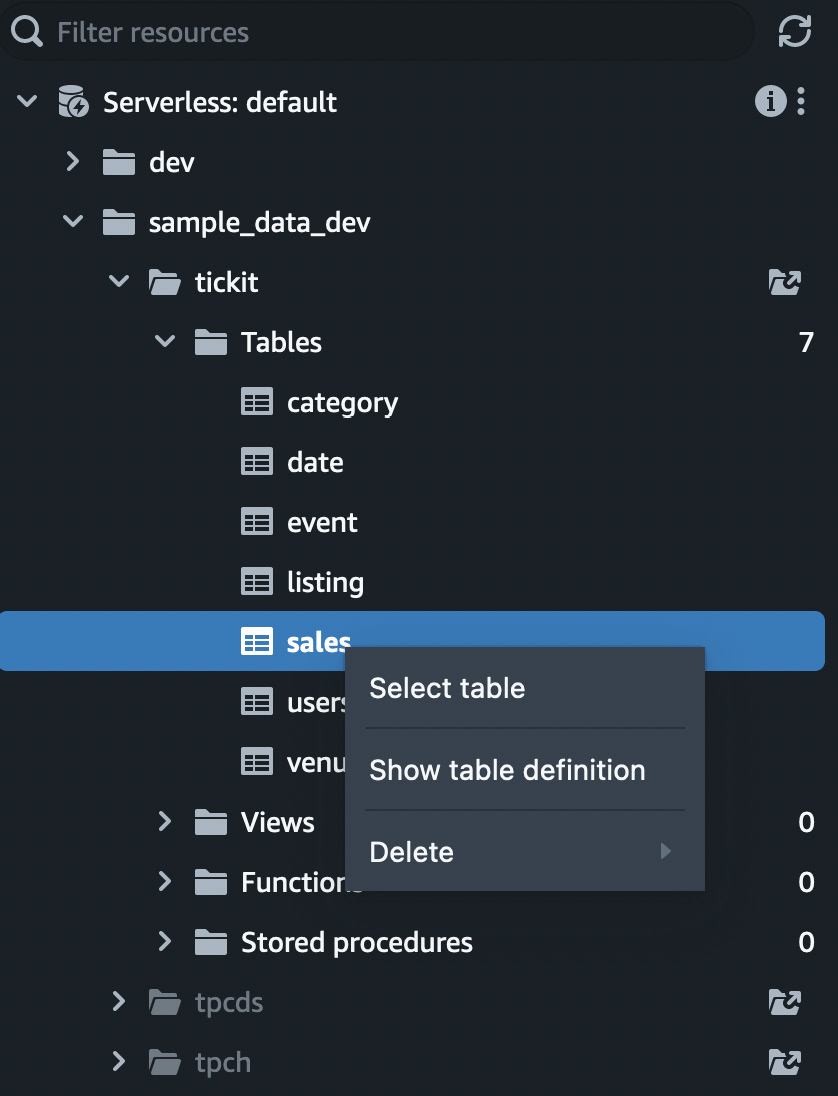
Figure 1.23 – Right-clicking on a table to view more options
You can click Run all, as shown in Figure 1.24, to run all the queries in the sample notebook. The query editor provides a notebook interface to add annotation, and SQL cells organize your queries in a single document. You can use annotations for documentation purposes.
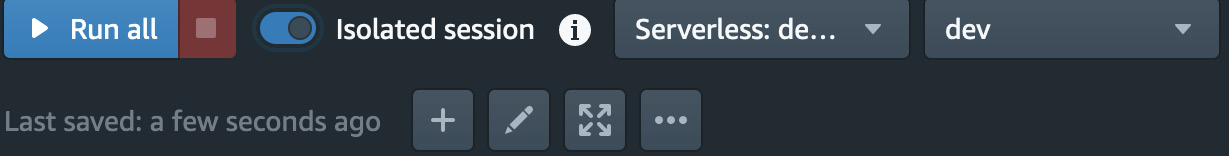
Figure 1.24 – The “Run all” option
You will see the results of your queries for each cell. You can download the results as JSON or CSV files to your desktop, as shown in Figure 1.25:
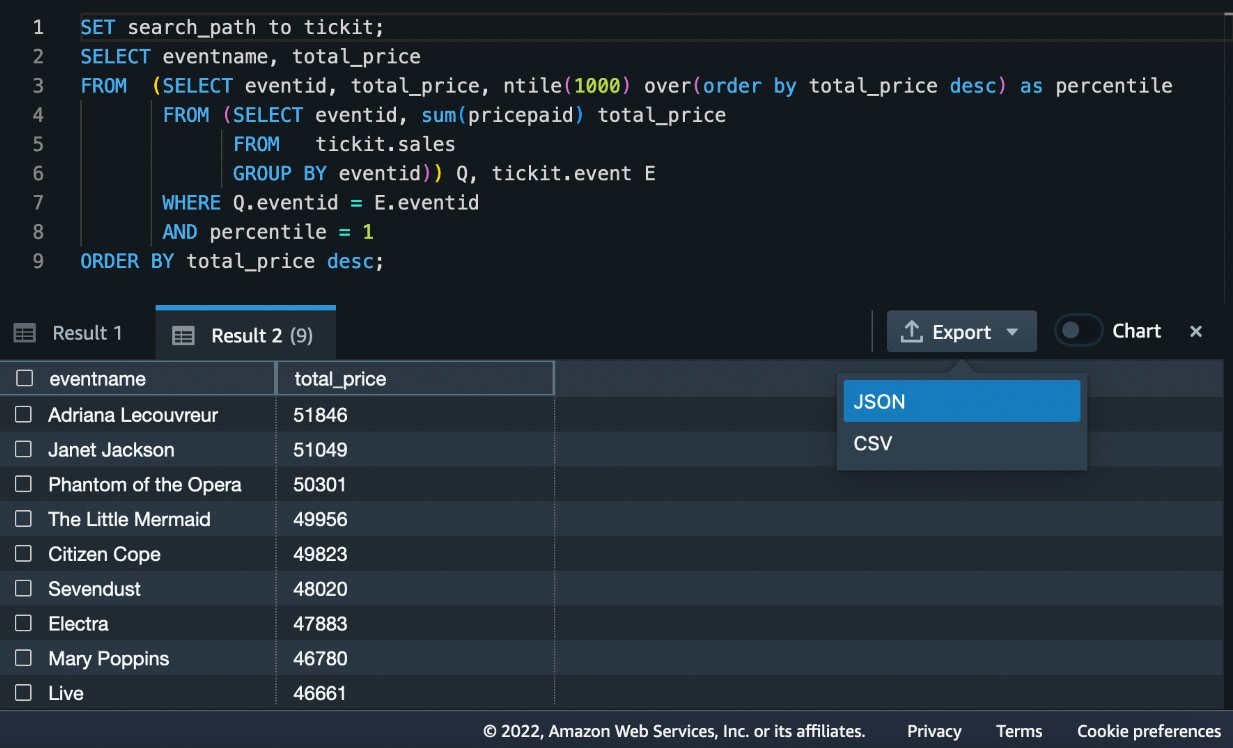
Figure 1.25 – Options to download query results
Let’s author our first query.
Running your first query
We want to find out the top 10 events by sales in the tickit database. We will run the following SQL statement in the data warehouse:
SELECT eventname, total_price
FROM  (SELECT eventid, total_price, ntile(1000) over(order by total_price desc) as percentile
       FROM (SELECT eventid, sum(pricepaid) total_price
             FROM   tickit.sales
             GROUP BY eventid)) Q, tickit.event E
       WHERE Q.eventid = E.eventid
       AND percentile = 1
ORDER BY total_price desc
limit 10;
In the query editor, add a new query by clicking on the + sign and selecting Editor from the menu that appears. If you wanted to create a new notebook, you could click on Notebook instead, as shown in Figure 1.26:
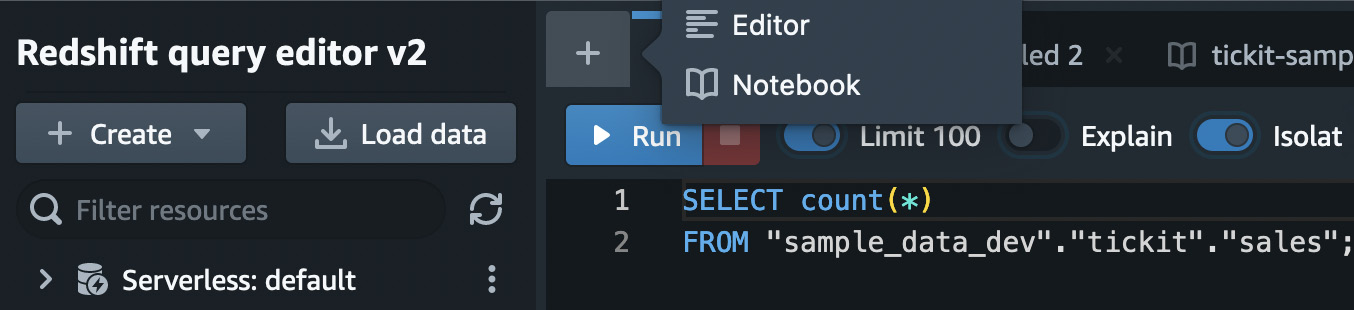
Figure 1.26 – Creating a new query
Now, type the preceding SQL query in the editor and then click on Run. You will get the results as shown in the following screenshot:
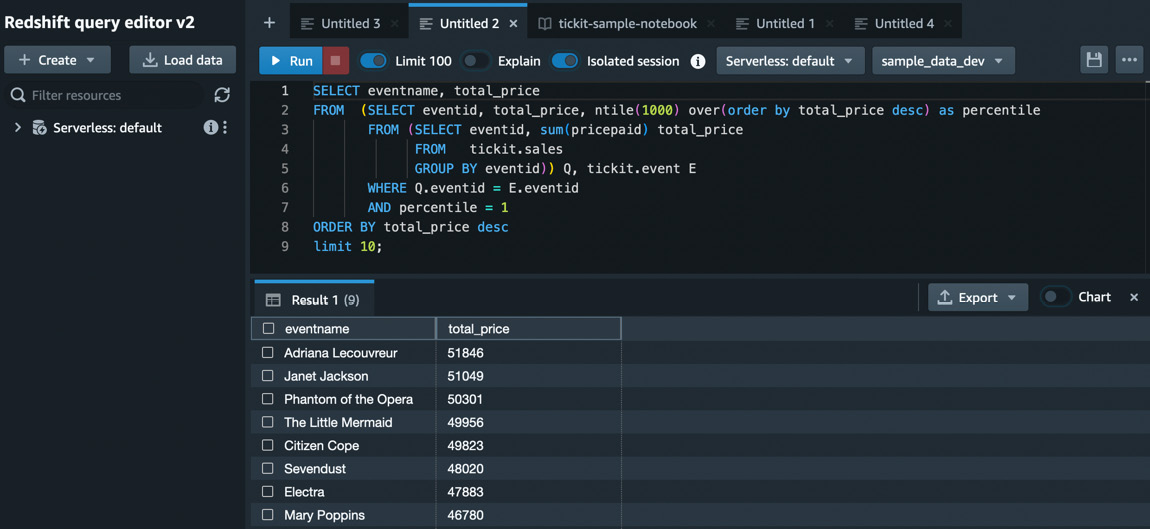
Figure 1.27 – Query with results
As the saying goes, “A picture is worth a thousand words,” and query editor allows you to visualize the results to gain faster insight. You can create a chart easily by clicking on the Chart option and then selecting the chart you want. Let’s select a scatter plot, as shown in Figure 1.28:
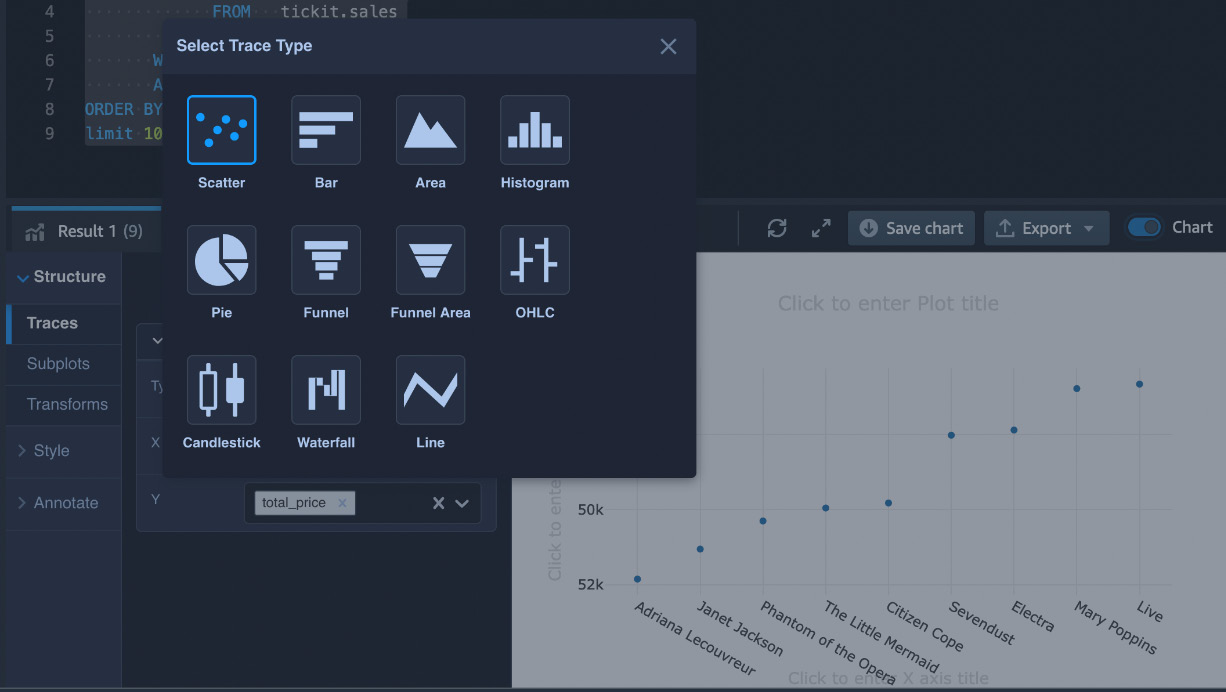
Figure 1.28 – Using charts in Redshift query editor v2
You can add a chart name and notations for the X and Y axes and export the chart as PNG or JPG to put in your presentation or to share with your business partners:
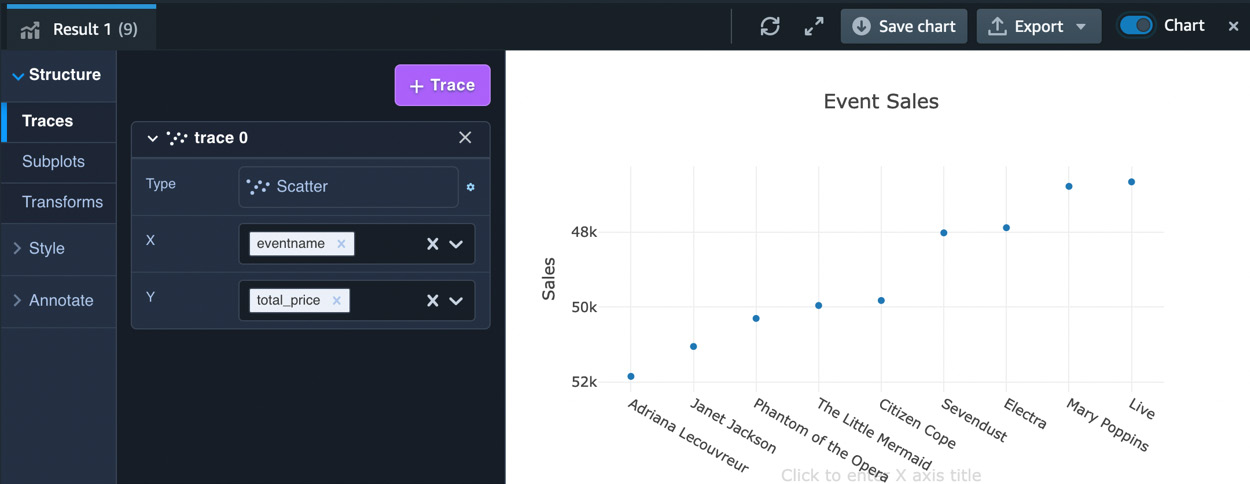
Figure 1.29 – Charting options in query editor v2
As you have now seen, you can use Redshift query editor v2 to create your own database, create tables, load data, and run and author queries and notebooks. You can share your queries and notebooks with your team members.


